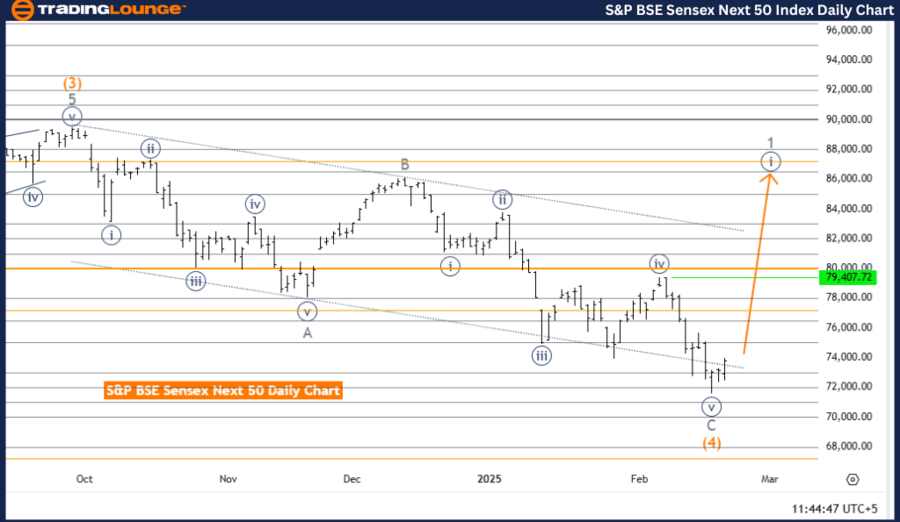
S&P BSE Sensex (India) Elliott Wave Analysis – Daily Chart
S&P BSE Sensex (India) Wave Technical Analysis
Function: Bullish Trend
Mode: Impulsive
Structure: Navy Blue Wave 1
Position: Gray Wave 1
Direction Next Higher Degrees: Navy Blue Wave 1 (Started)
Details:
The S&P BSE Sensex (India) Elliott Wave Analysis for the daily chart confirms a bullish trend based on Elliott Wave Theory, which identifies repetitive price wave patterns.
The market is currently in an impulsive phase, indicating strong directional momentum. The structure is defined as navy blue wave 1, part of a broader gray wave 1, confirming that the bullish trend is in its early stages.
With navy blue wave 1 now in progress, this marks the beginning of a new upward cycle, characterized by strong buying pressure. The next higher-degree wave, navy blue wave 1, has already begun, reinforcing the bullish sentiment.
Investors and traders should focus on the progression of navy blue wave 1, as it plays a key role in shaping the larger market movement within the gray wave 1 structure.
Summary:
- S&P BSE Sensex daily chart analysis suggests the start of a bullish cycle, with navy blue wave 1 of gray wave 1 currently unfolding.
- The impulsive nature of this wave signals strong buying momentum and positive market sentiment.
- Traders should monitor navy blue wave 1 closely, as its strength will determine the sustainability of the uptrend.
- This analysis highlights an optimistic outlook for the S&P BSE Sensex, which may influence trading strategies and market participation.
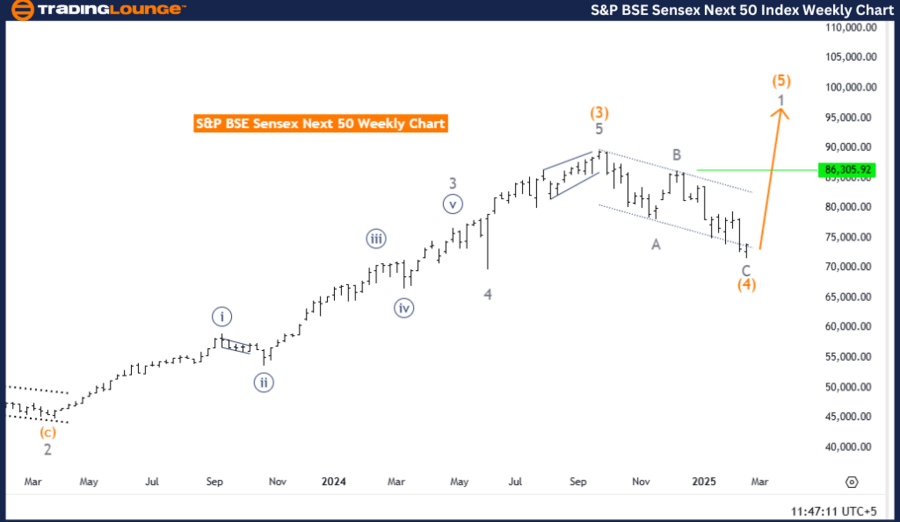
S&P BSE Sensex (India) Elliott Wave Analysis – Weekly Chart
S&P BSE Sensex (India) Wave Technical Analysis
Function: Bullish Trend
Mode: Impulsive
Structure: Gray Wave 1
Position: Orange Wave 5
Direction Next Higher Degrees: Gray Wave 1 (Started)
Details:
The S&P BSE Sensex (India) Elliott Wave Analysis for the weekly chart reinforces a bullish trend. This analysis, based on Elliott Wave Theory, identifies predictable price wave patterns, helping traders navigate market movements.
The market remains impulsive, indicating a strong directional move. The current wave structure is defined as gray wave 1, forming part of a broader orange wave 5. This confirms that the market is continuing its bullish trajectory, with gray wave 1 of orange wave 5 currently unfolding.
With orange wave 4 appearing complete, the transition into gray wave 1 of orange wave 5 signals resumed upward momentum. Since orange wave 5 is typically the final wave in a sequence, this uptrend could be sustained until completion.
The next higher-degree wave, gray wave 1, has already started, reinforcing the positive sentiment for the S&P BSE Sensex. This wave is typically associated with strong buying pressure, further confirming the bullish outlook.
Summary:
- The weekly chart analysis suggests that the bullish trend is still intact, with gray wave 1 of orange wave 5 currently active.
- The completion of orange wave 4 and the activation of gray wave 1 indicate a renewed bullish push.
- Traders should monitor the progression of gray wave 1, as it will provide key insights into the trend's strength and sustainability.
- The ongoing impulsive wave structure suggests that Sensex may continue its upward movement in the near term.
This analysis presents a favorable outlook for the S&P BSE Sensex, providing traders with critical data to refine their trading strategies and decision-making.
Technical Analyst: Malik Awais
Source: visit Tradinglounge.com and learn From the Experts Join TradingLounge Here
Previous: Shanghai Composite Elliott Wave Technical Analysis
VALUE Offer - Buy 1 Month & Get 3 Months!Click here
Access 7 Analysts Over 200 Markets Covered. Chat Room With Support