SOLANA/ U.S. Dollar (SOLUSD) Elliott Wave Analysis – TradingLounge Daily Chart
SOLUSD Elliott Wave Technical Analysis
Function: Counter-trend
Mode: Corrective
Structure: Flat
Position: Wave B
Next Direction (Higher Degree):
Invalidation Level:
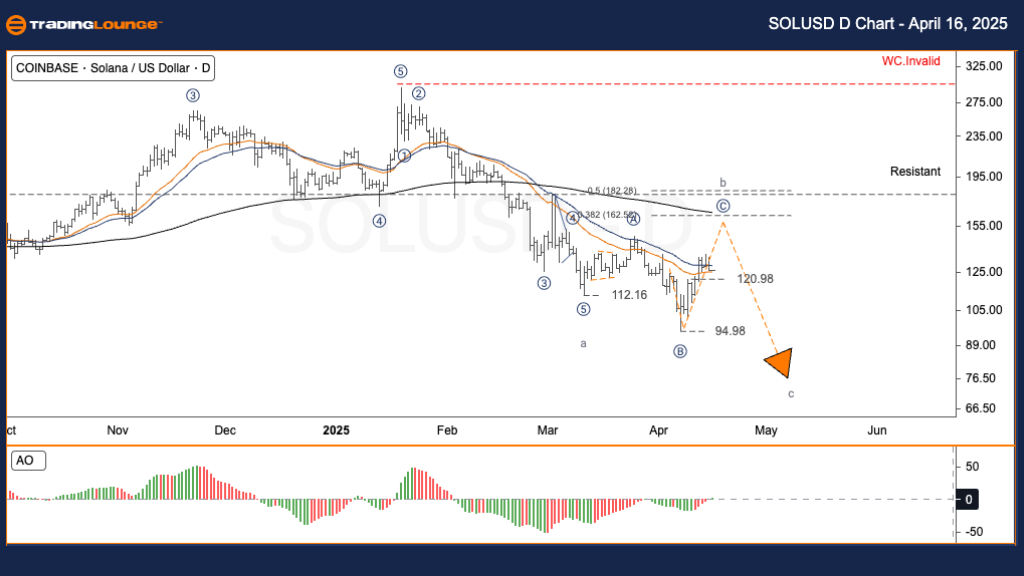
Solana (SOLUSD) Elliott Wave Analysis & Trading Strategy – Daily Chart
The daily Elliott Wave outlook for Solana (SOLUSD) continues to indicate an ongoing corrective phase. According to the wave count, the market is currently unfolding Wave C within a broader ABC flat correction. The highs around $210–$215, reached in early 2025, likely marked the completion of a larger impulsive structure (Wave V). Since then, the downtrend has persisted with reduced momentum. Wave a completed near $112.16, followed by a corrective bounce forming Wave b. Wave c is now active and progressing, pointing to further potential downside.
Trading Strategy
Strategy
✅ For short-term traders (Swing Trade)
Monitor the $130 level for a potential bearish reversal signal. If price action rejects resistance near this level, a short trade setup could emerge. Set stop-loss protection slightly above $135.
Ensure strict risk parameters are in place due to the ongoing corrective structure and potential for volatile price movements.
SOLANA/ U.S. Dollar (SOLUSD) Elliott Wave Analysis – TradingLounge H4 Chart
SOLUSD Elliott Wave Technical Analysis
Function: Counter-trend
Mode: Corrective
Structure: Flat
Position: Wave B
Next Direction (Higher Degree):
Invalidation Level:
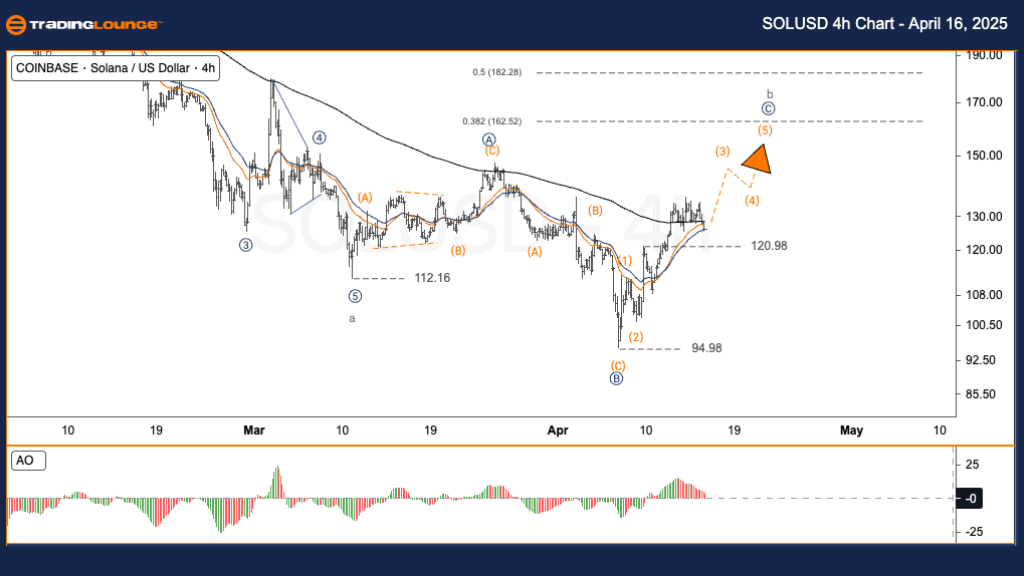
Solana (SOLUSD) Elliott Wave Analysis & Trading Strategy – H4 Chart
The 4-hour chart of Solana (SOLUSD) also shows an unfinished correction, with Wave C of the ABC pattern still unfolding. The high range of $210–$215 reached earlier in 2025 likely concluded the major Impulse Wave (Wave V). Since then, SOLUSD has moved lower with softening momentum. Wave a ended near $112.16, and a moderate retracement formed Wave b. Presently, Wave c is in motion, signaling the continuation of the corrective phase.
Trading Strategy
Strategy
✅ For short-term traders (Swing Trade)
Watch for a bearish setup near the $130 resistance zone. A clear rejection at Fibonacci levels could trigger a short opportunity. Use a stop loss positioned above $135 for trade safety.
Maintain tight stop-loss levels and manage position sizes carefully during this corrective wave structure.
Technical Analyst: Kittiampon Somboonsod, CEWA
Source: Visit Tradinglounge.com and learn from the Experts Join TradingLounge Here
Previous: ADAUSD Elliott Wave Technical Analysis
VALUE Offer - Buy 1 Month & Get 3 Months!Click here
Access 7 Analysts Over 200 Markets Covered. Chat Room With Support