05Feb

Navigating Markets: Weekly Forex, Crypto, Stocks Insights & Trade Opportunities (5th-9th February 2024)

Welcome to our Weekly Elliott Wave Analysis Report, offering insightful perspectives and trade ideas on some of the Forex, Crypto, and Stocks we have on our watchlist next week.

In this edition, we will focus on EURUSD, GBPAUD, AUDJPY, GBPJPY, ADAUSD, BTCUSD, and Exxon Mobil. The analysis aims to provide traders with succinct yet comprehensive insights, enabling informed decisions in the swiftly evolving financial markets.

EURUSD

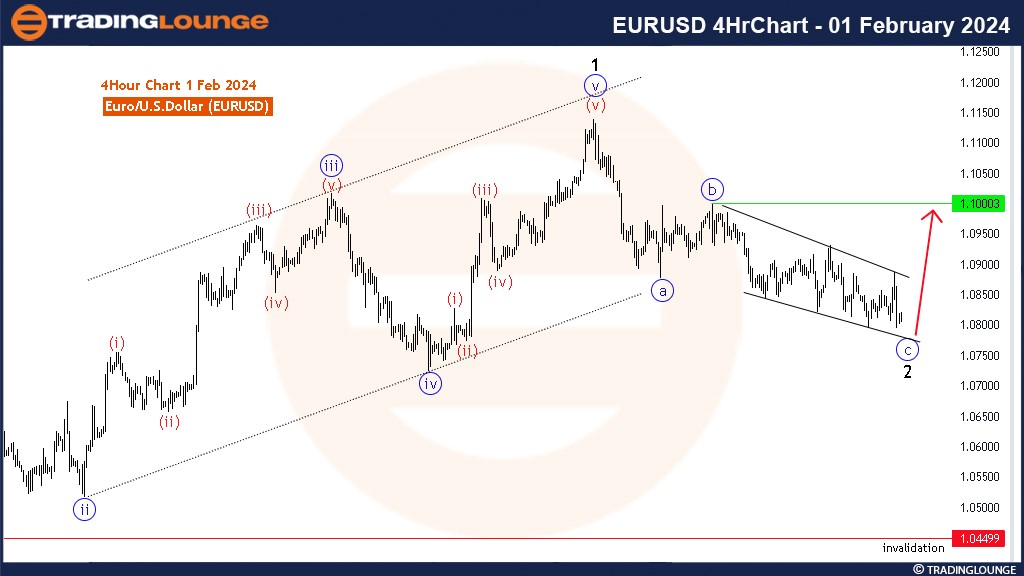
The currency pair recently concluded a bearish corrective Elliott wave zigzag pattern that commenced on December 28. Identified as wave 2 correction within the broader impulse wave rally from October 4 to December 29, 2023, wave c of the higher degree corrective wave 2 completed an ending diagonal structure. We anticipate an upside breakout post-diagonal, resuming the bullish trend after finding support near the psychological level of 1.08. A potential impulsive breakout next week is expected to propel the pair towards 1.1

EURUSD-4hrchart-0102...


GBPAUD

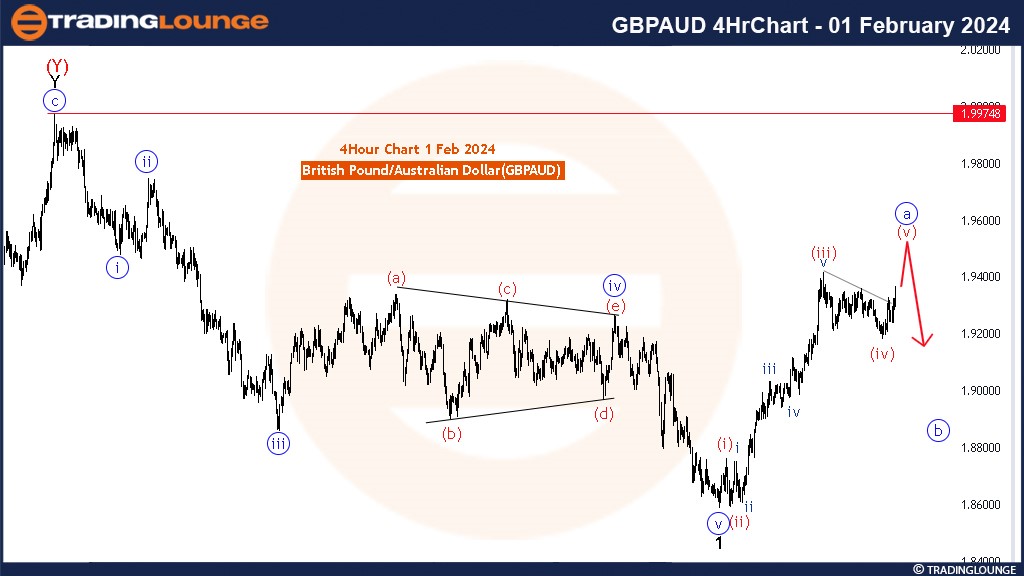
Having completed a bearish impulse wave near the 1.86 psychological level, GBPAUD experienced an impulsive run towards 1.94. Wave (iv) (in red) found support at 1.92, suggesting an opportunity for a run towards 1.96 to complete the impulse wave. While the pair touched 1.945, caution is advised as wave a may be near completion, potentially leading to a 3-wave bearish correction next week. Traders should also monitor potential divergences on momentum indicators.

GBPAUD-4Hrchart-01fe...


AUDJPY

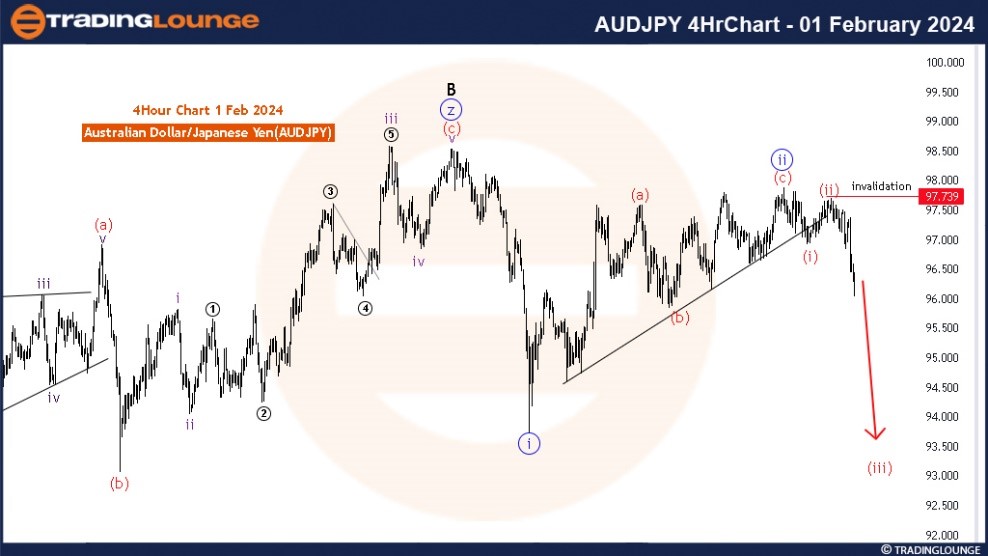
Breaking below 97 last week, AUDJPY initiated a decline within wave (iii) (in red) of iii (in blue). A double zigzag completed near 98, leading to a fall to 95.5. Anticipating a further decline to complete red wave (iii) to (v) towards 94.5-94 support.
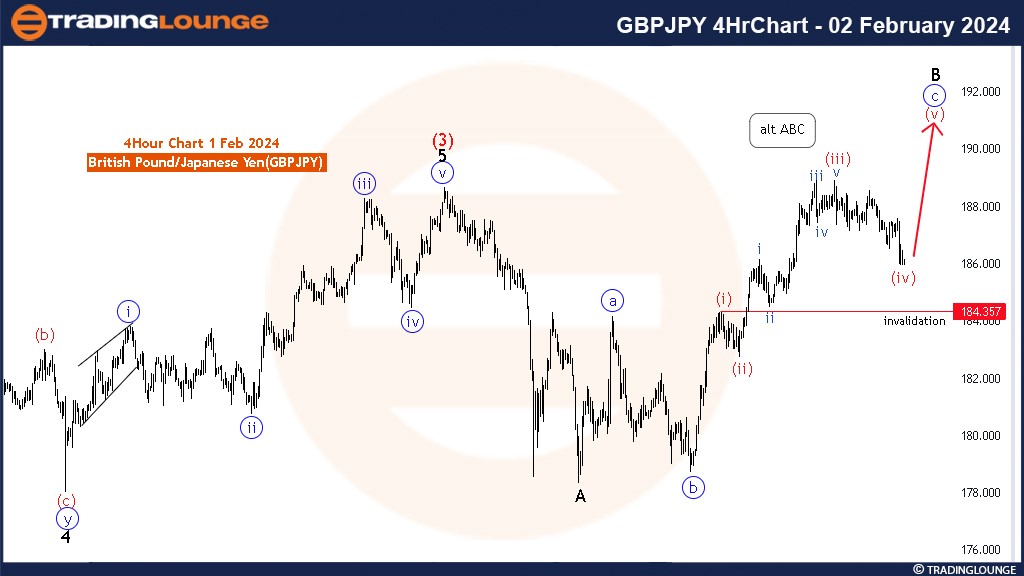
AUDJPY-4HRchart-01fe...


GBPJPY

Wave (4) completion is anticipated in an expanding flat pattern, with wave B currently in progress. Sub-wave (iv) (in red) is expected as part of the impulse, with a further rally projected above 188 towards 190 and 191 next week. The invalidation level is set at 184.35.
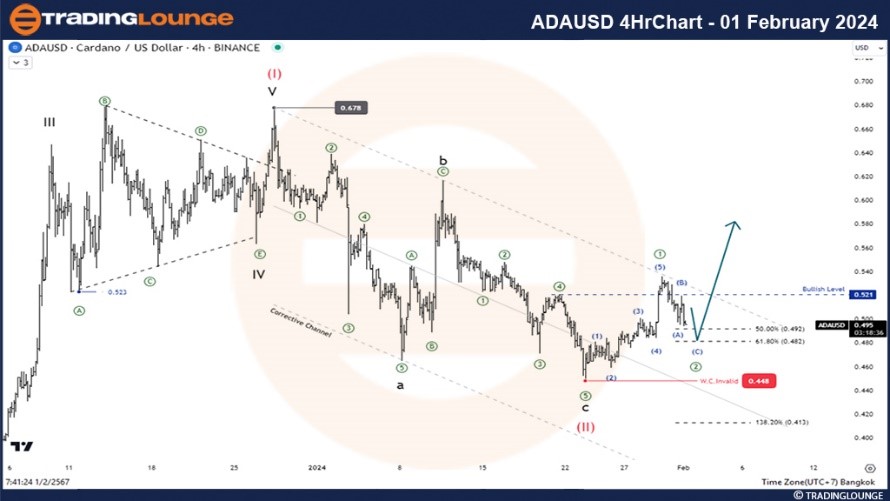
GBPJPY-4hrchart-02Fe...


ADAUSD

After a bullish impulse wave trend ending at 0.678, Cardano underwent a corrective decline to 0.447. A bullish reaction post-0.448 hints at a potential resumption of the long-term bullish trend in February. A break above 0.537 is crucial for confirming an impulse wave move towards the 0.678 resistance. Conversely, a break below 0.448 before 0.537 may suggest a bearish correction.
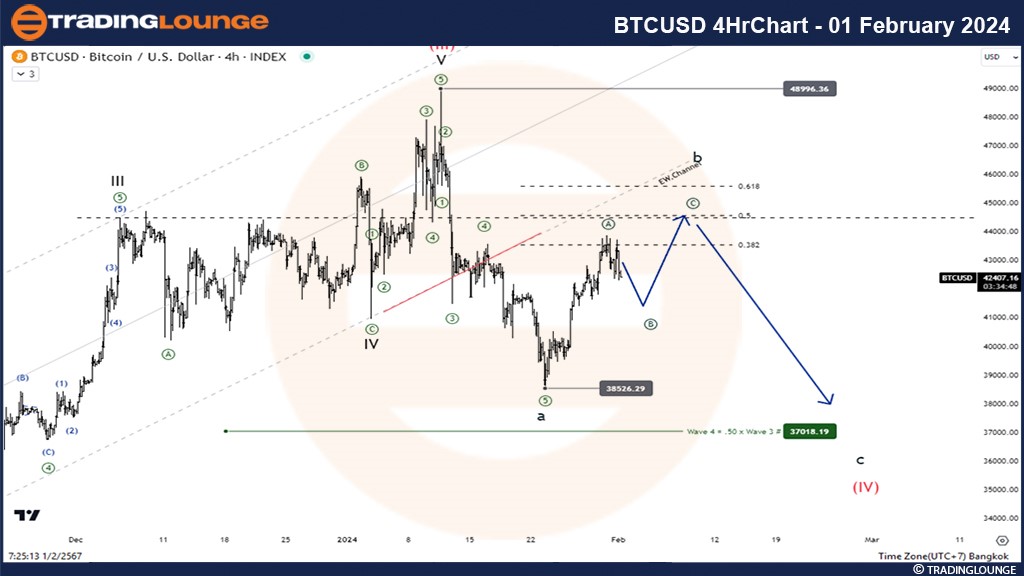
ADAUSD-4Hrchart-01Fe...


BTCUSD

Following over two years of a sustained bullish trend, Bitcoin initiated a dip in January, completing a bearish impulse wave. A 3-wave bullish correction is underway, with wave a (circled in green) around 43,900. Expecting a decline for wave b before rallying to 45,000-46,000. Subsequent bearish correction from 49,000 will continue for wave c of (IV) (in red).
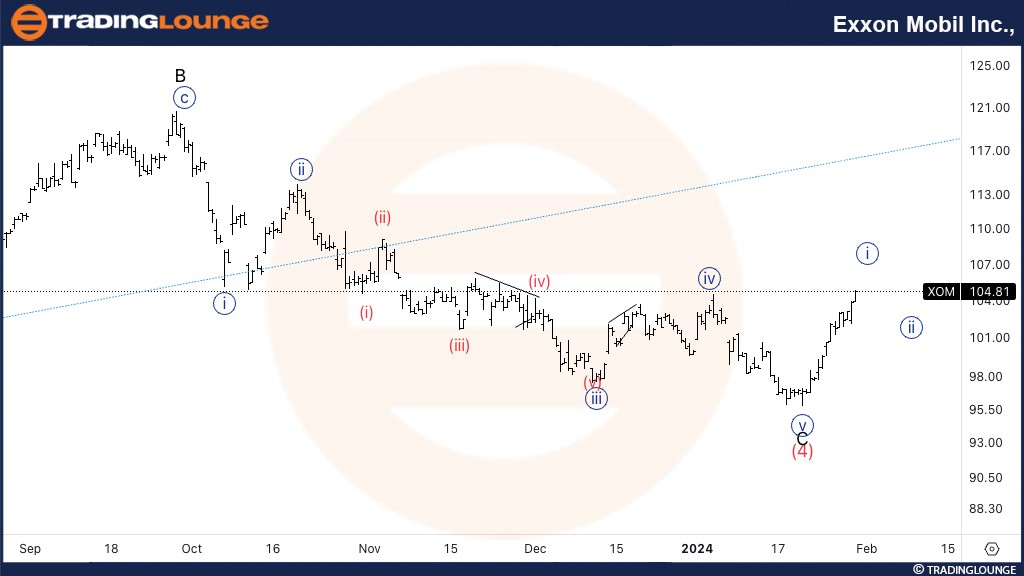
BTCUSD-4Hrchart-01fe...


Exxon Mobil

EXO's impressive rally from $96 to almost $105 is likely in response to the completion of wave (4) in red, spanning 8 months. A minor correction is anticipated next week before the stock progresses further above $110 and potentially towards higher prices.

Exxon-Mobil-Inc

Related

Elliott Wave Analysis: Uncover Trading Strategies on S&P 500, NASDAQ 100, DAX 40, FTSE 100 & ASX 200

Elliott Wave Analysis: Uncover Trading Strategies on S&P 500, NASDAQ 100, DAX 40, FTSE 100 & ASX 200

Our latest blog post delves into Elliott Wave analysis on major indices like the S&P 500, NASDAQ 100...

Read More >
Insights into the Current Trends in the ASX Market: ASX LIMITED Stock Analysis & ASX Elliott Wave Technical Forecast

Insights into the Current Trends in the ASX Market: ASX LIMITED Stock Analysis & ASX Elliott Wave Technical Forecast

This article provides an in-depth Elliott Wave analysis of ASX Limited, focusing on its potential pr...

Read More >
Vechain (VETUSD) Elliott Wave Insight: Wave II Retracement Setup, Swing Trade Entry Zones and Risk Strategy Detailed Analysis

Vechain (VETUSD) Elliott Wave Insight: Wave II Retracement Setup, Swing Trade Entry Zones and Risk Strategy Detailed Analysis

This Vechain (VETUSD) Elliott Wave report covers daily and 4-hour chart structures. Following Wave (...

Read More >
Polkadot/U.S. dollar(DOTUSD) Elliott Wave Technical Analysis 25 January 24

Polkadot/U.S. dollar(DOTUSD) Elliott Wave Technical Analysis 25 January 24

Today's crypto Chart by TradingLounge for Polkadot and U.S. dollar Elliott Wave Technical Analys...

Read More >
Visa Inc.(V:NYSE) Elliott Wave Technical Analysis 23 November 23

Visa Inc.(V:NYSE) Elliott Wave Technical Analysis 23 November 23

Visa Inc.(V: NYSE) Elliott Wave Technical Analysis Dated 23 November 23 with 1Hr and 4Hr Chart,

Read More >

$1 for 2 Weeks

then $29 a month!

What a Special Offer!

Trade Recommendations

Unleash the power of deversified trading with our comprehensive portfolio, covering 250+ markets:

  • Stock Trades
  • Crypto Trades
  • Forex Trades
  • Commodity Trades
Elliott Wave Analysis

Gain a competitive edge with expert insights and AI-powered Elliott Wave charting into:

  • Global Indices
  • US Stocks & ASX Stocks
  • Forex & Crypto
  • Commodities
Top-Notch Trading Tools

Equip yourself with the tools of success:

  • Real-time Chat rooms
  • Elliott Wave Algorithm
  • Portfolio tools
  • TradingLevels
  • Screener
  • Trading Game
7 Elliott Wave Analysts

Stay ahead of the market with daily charts and insightful videos
Your secret to strategic trading!

JOIN HERE


Welcome to TradingLounge (ASIC A.R.No. 321187), specialists in trades, trading education and technical analysis, covering stocks, indices, commodities, forex and cryptocurrencies.

When you join TradingLounge you have access to everything we offer, including trade tools, educational content and a social platform to chat with like-minded investors.

Read more

@Copyright 2024 by tradinglounge.com

Contact Us

Australian no: 02 4787 6020

International no: +61 (2) 47876020

Pay with:

Find us on