01May

Coffee Commodity Elliott Wave Technical Analysis: A Deep Dive into the Current Market Trends

Coffee Elliott Wave Analysis

Function - Counter-trend 
Mode - Corrective 
Structure - Possible Zigzag for B 
Position - Wave B of (Y)
Direction - Wave B of  (Y) is still in progress
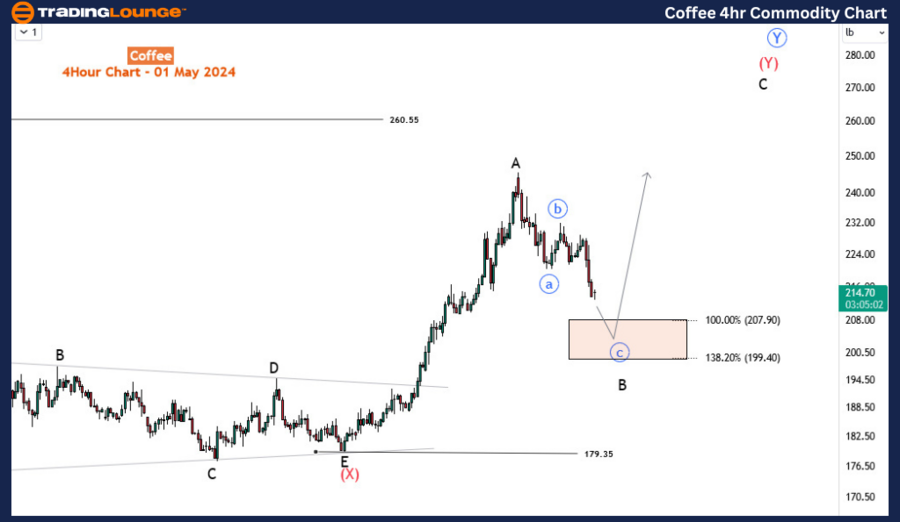
Details - Wave B is still in progress. It looks to be in the last leg for a zigzag structure. The decline could continue to 207-to-199 before returning upside for wave C.

Coffee prices have embarked on a nuanced journey post the robust impulse breakout witnessed since March 19, signifying a potential completion of a significant phase. Preceding this surge, the commodity had languished within a confined sideways range for a span of three months. The ongoing descent appears poised to persist within the framework of a zigzag structure, setting the stage for an eventual upward trajectory in alignment with the broader resurgence.

Insight from the Daily Chart

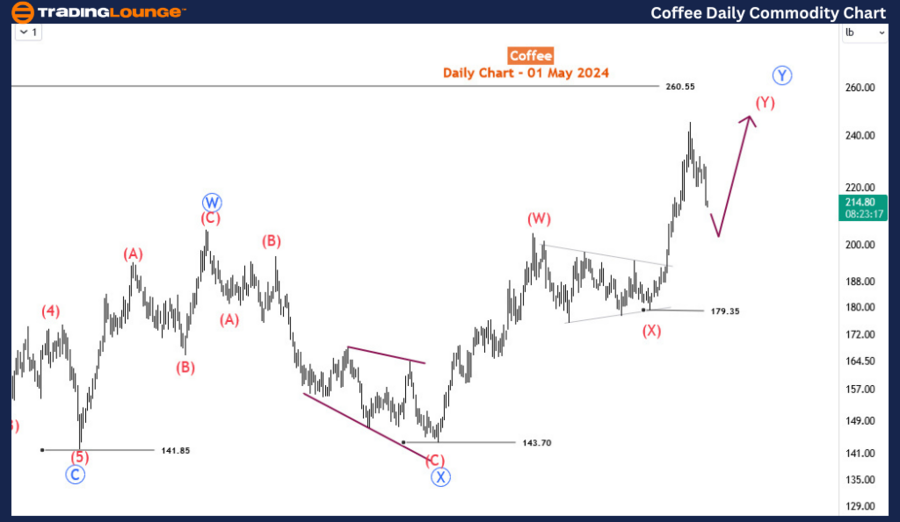
Delving into the daily chart reveals the unfolding of a bullish double zigzag pattern originating from 141.85 in January 2023. This intricate pattern likely constitutes the second leg of a larger corrective wave initiated back in February 2022. For analytical simplicity, our focus remains on the double zigzag structure stemming from 141.85, as depicted on the daily chart. Presently, this double zigzag is navigating through its final wave – denoted as primary degree blue wave W. Blue wave W, in turn, unfolds as a double zigzag at the intermediate degree, delineated as waves (W)-(X)-(Y). The preceding three-month consolidation period culminated in the formation of a triangle pattern, notably identified as wave (X), at the 179.35 mark. The ongoing wave Y also appears to be materializing into a double zigzag, with the current downturn representing its second leg, preceding an anticipated upward surge to finalize wave (Y) of blue Y.
Coffee-daily-Commodi...


Coffee Commodity H4 Chart Perspective

Zooming in on the H4 chart accentuates the present retracement, identified as wave B of (Y). This corrective wave is conceivably in the process of completing a zigzag pattern and may discover support within the Fibonacci zone spanning from 207.9 to 199.40. Consequently, a subsequent wave C is anticipated to manifest, propelling prices higher, potentially surpassing the April 18th high.

However, a decisive breach beneath this support zone, coupled with a violation of the 161.8% extension level at 194.3, could herald the emergence of an impulse wave. Such a scenario could entail a more profound corrective pullback, challenging the integrity of the 179.35 low, or even signaling the culmination of wave (Y) at the April 18th peak, paving the way for a broader downturn encompassing primary degree wave Y (blue).

Technical Analyst: Sanmi Adeagbo

Source: visit Tradinglounge.com and learn From the Experts Join TradingLounge Here 

See Previous: GX Uranium ETF (URA) Elliott Wave Analysis

Special Trial Offer - 0.76 Cents a Day for 3 Months! Click here

Access 6 Analysts covering over 150 Markets. Chat Room With Support
Coffee-4h-Commodity-...

Related

NZDUSD Elliott Wave Technical Analysis: Bullish Wave 3 Momentum and Price Forecast on Daily and 4-Hour Forex Charts

NZDUSD Elliott Wave Technical Analysis: Bullish Wave 3 Momentum and Price Forecast on Daily and 4-Hour Forex Charts

Analyse NZDUSD’s Elliott Wave structure with our updated daily and 4-hour forecast. Discover wave 3...

Read More >
Coca-Cola (KO) Stock Analysis: KO Elliott Wave Technical Analysis & Technical Insights

Coca-Cola (KO) Stock Analysis: KO Elliott Wave Technical Analysis & Technical Insights

Delve into a comprehensive analysis of The Coca-Cola Company (KO) stock through the lens of Elliott ...

Read More >
Dow Jones Forecast Using Elliott Wave: Bullish Trend Confirmed with Impulse Wave Signals on Daily and Weekly DJI Charts

Dow Jones Forecast Using Elliott Wave: Bullish Trend Confirmed with Impulse Wave Signals on Daily and Weekly DJI Charts

This Dow Jones Elliott Wave analysis outlines a bullish outlook with impulsive wave structures, conf...

Read More >
Grasim Industries Stock Forecast: Elliott Wave Technical Analysis, Key Levels, and Bullish Targets for 2024

Grasim Industries Stock Forecast: Elliott Wave Technical Analysis, Key Levels, and Bullish Targets for 2024

This article provides a technical analysis of Grasim Industries Ltd using Elliott Wave theory. It hi...

Read More >
Euro/British Pound EURGBP Forex Elliott Wave Technical Analysis: In-Depth Insights for Daily and 4-Hour Charts

Euro/British Pound EURGBP Forex Elliott Wave Technical Analysis: In-Depth Insights for Daily and 4-Hour Charts

Our EURGBP Elliott Wave Analysis provides a thorough examination of the Euro against the British Pou...

Read More >
Amazon Inc.(AMZN:NASDAQ) Elliott Wave Technical Analysis 25 October 23

Amazon Inc.(AMZN:NASDAQ) Elliott Wave Technical Analysis 25 October 23

Amazon Inc.(AMZN:NASDAQ) Elliott Wave Technical Analysis For 25 October 23 with 1-Hour and 4-Hour St...

Read More >

$1 for 2 Weeks

then $29 a month!

What a Special Offer!

Trade Recommendations

Unleash the power of deversified trading with our comprehensive portfolio, covering 250+ markets:

  • Stock Trades
  • Crypto Trades
  • Forex Trades
  • Commodity Trades
Elliott Wave Analysis

Gain a competitive edge with expert insights and AI-powered Elliott Wave charting into:

  • Global Indices
  • US Stocks & ASX Stocks
  • Forex & Crypto
  • Commodities
Top-Notch Trading Tools

Equip yourself with the tools of success:

  • Real-time Chat rooms
  • Elliott Wave Algorithm
  • Portfolio tools
  • TradingLevels
  • Screener
  • Trading Game
7 Elliott Wave Analysts

Stay ahead of the market with daily charts and insightful videos
Your secret to strategic trading!

JOIN HERE


Welcome to TradingLounge (ASIC A.R.No. 321187), specialists in trades, trading education and technical analysis, covering stocks, indices, commodities, forex and cryptocurrencies.

When you join TradingLounge you have access to everything we offer, including trade tools, educational content and a social platform to chat with like-minded investors.

Read more

@Copyright 2024 by tradinglounge.com

Contact Us

Australian no: 02 4787 6020

International no: +61 (2) 47876020

Pay with:

Find us on