NZDUSD Elliott Wave Analysis Trading Lounge Day Chart,
New Zealand Dollar/U.S.Dollar(NZDUSD) Day Chart
NZDUSD Elliott Wave Technical Analysis
FUNCTION: Trend
MODE: impulsive
STRUCTURE: red wave 3
POSITION: blue wave 1
DIRECTION NEXT HIGHER DEGREES: red wave 4
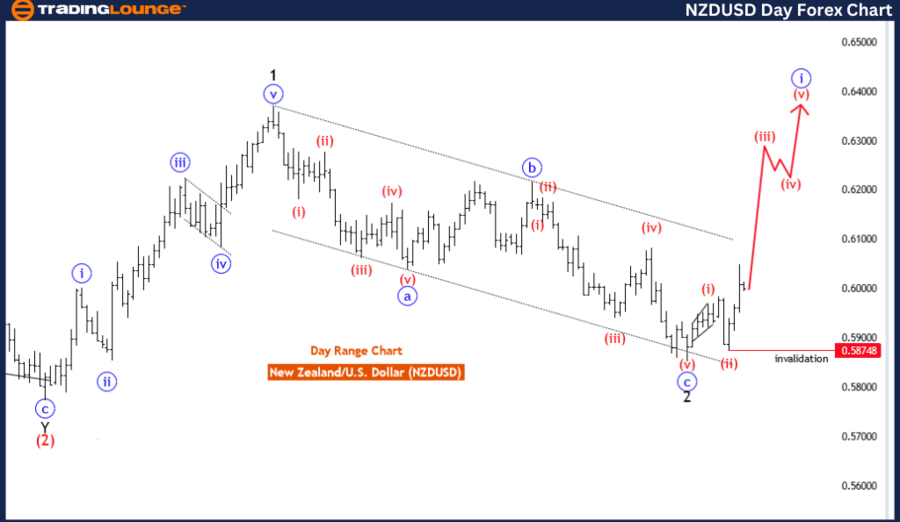
DETAILS red wave 2 of 1 looking completed at 0.58748, now red wave 3 of 1 is in play . Wave Cancel invalid level: 0.58748
The NZD/USD Elliott Wave Analysis for the Day Chart provides a technical examination of the New Zealand Dollar against the U.S. Dollar, focusing on Elliott Wave patterns to predict market trends and determine key levels of market movement. This analysis encompasses the function, mode, structure, position, and key details relevant to understanding the current market phase.
Function
The function is identified as "Trend," suggesting that the broader market movement is expected to continue in a general direction, likely upward, with the use of Elliott Wave theory to guide this interpretation.
Mode
The mode is described as "impulsive," indicating that the current structure is part of a larger upward momentum, typically consisting of five sub-waves. This pattern suggests that the market is currently experiencing a drive toward higher levels, with minor corrective phases along the way.
Structure
The structure is categorized as "red wave 3," signifying that this is the third wave within a broader Elliott Wave pattern. Impulsive structures, like wave 3, often represent the strongest and most directional phases of a trend.
Position
The position within the structure is "blue wave 1," indicating that the current pattern represents an initial upward thrust in the broader trend. This implies that the market has resumed its upward trajectory following the completion of "red wave 2 of 1," suggesting a continuation of the overall impulsive trend.
Direction for the Next Higher Degrees
The direction for the next higher degrees is "red wave 4," indicating that after the completion of "red wave 3," a smaller corrective phase is anticipated, followed by further upward movement.
Details
The details section highlights that "red wave 2 of 1" is either completed or very close to completion at a level of 0.58748, suggesting that the corrective phase has concluded. With "red wave 3 of 1" currently in play, the market is expected to continue its upward momentum. The Wave Cancel invalid level is set at 0.58748, indicating that a move below this level would invalidate the current wave structure, necessitating a re-evaluation of the Elliott Wave pattern.
In summary, the NZD/USD Elliott Wave Analysis for the Day Chart indicates an impulsive upward trend, with "red wave 3 of 1" leading the current movement. The analysis suggests that this wave will continue its upward trajectory, with a subsequent correction in "red wave 4" before resuming its broader trend. The Wave Cancel invalid level at 0.58748 is a critical point for determining if the current trend remains valid.
NZDUSD Elliott Wave Analysis Trading Lounge 4 Hour Chart,
New Zealand Dollar/U.S.Dollar(NZDUSD) 4 Hour Chart
NZDUSD Elliott Wave Technical Analysis
FUNCTION: Trend
MODE: corrective
STRUCTURE: black wave 2
POSITION: red wave 3
DIRECTION NEXT HIGHER DEGREES: black wave 3
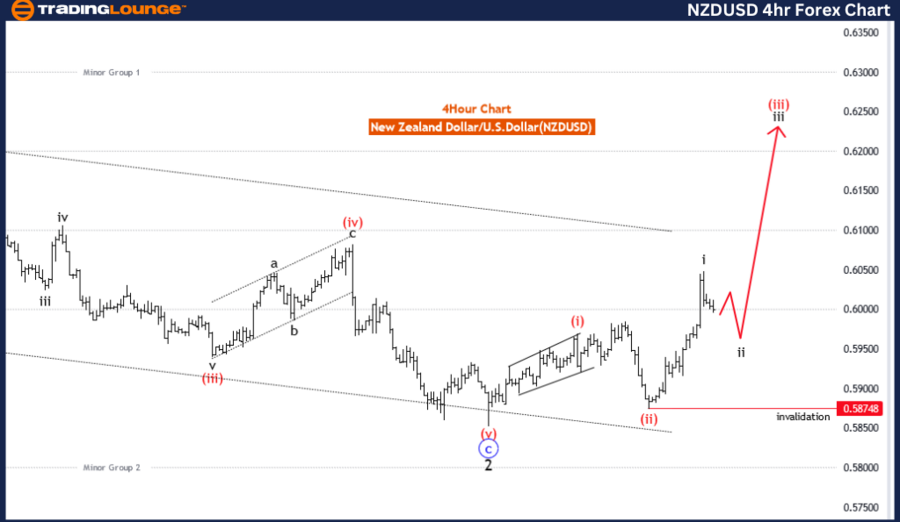
DETAILS black wave 1 of 3 looking completed at 0.60486, now black wave 2 of 3 is in play . Wave Cancel invalid level: 0.58748
The NZD/USD Elliott Wave Analysis for the 4-Hour Chart provides insights into the market behavior of the New Zealand Dollar against the U.S. Dollar, using the Elliott Wave theory to identify patterns, trends, and key market levels. This summary focuses on the overall function, mode, structure, and position within the Elliott Wave cycle, while emphasizing crucial details that define the current market situation.
Function
The function of the current wave pattern is classified as "Trend," indicating that the overall market direction is part of a broader Elliott Wave sequence. This suggests that the trend is generally upward, with corrections occurring within this larger trend.
Mode
The mode is described as "corrective," indicating that the ongoing wave structure represents a period of consolidation or retracement within a broader impulsive trend. Corrective waves typically consist of three sub-waves and suggest a temporary pullback before the trend resumes.
Structure
The structure is identified as "black wave 2," indicating that the current corrective wave is part of a larger Elliott Wave pattern. This implies that the trend is undergoing a pause or consolidation phase after the completion of "black wave 1."
Position
The position within the structure is "red wave 3," suggesting that the broader trend is experiencing a corrective phase, but with an overall upward direction. This indicates that "red wave 3" has completed its initial phase, with "black wave 2" currently in play.
Direction for the Next Higher Degrees
The direction for the next higher degrees is "black wave 3," indicating that once the current corrective phase completes, the trend is expected to continue its upward momentum.
Details
The details section specifies that "black wave 1 of 3" appears to have completed at 0.60486, indicating that the initial impulsive wave of the broader trend has ended. Currently, "black wave 2 of 3" is in play, suggesting a corrective or sideways movement before the trend resumes. The Wave Cancel invalid level is set at 0.58748, indicating that if the market price drops below this level, the existing wave structure may be invalidated, suggesting a possible shift in market direction.
In summary, the NZD/USD Elliott Wave Analysis for the 4-Hour Chart indicates a broader upward trend with a temporary corrective phase (black wave 2 of 3). This phase is expected to end soon, with a continuation of the impulsive trend. The Wave Cancel invalid level at 0.58748 serves as a critical threshold, guiding further analysis and adjustments to the Elliott Wave structure if breached.
Technical Analyst: Malik Awais
Source: visit Tradinglounge.com and learn From the Experts Join TradingLounge Here
See Previous: British Pound/U.S.Dollar(GBPUSD)
Special Trial Offer - 0.76 Cents a Day for 3 Months! Click here
Access 6 Analysts covering over 150 Markets. Chat Room With Support