Welcome to Our Latest Elliott Wave Analysis for Exxon Mobil Inc. (XOM) 

This analysis dives deep into the price movements of Exxon Mobil Inc. (XOM) using Elliott Wave Theory. Our goal is to help traders spot potential opportunities based on current trends and market structures. We will examine insights from both the daily and 4-hour charts to provide a thorough perspective on XOM's market behavior.

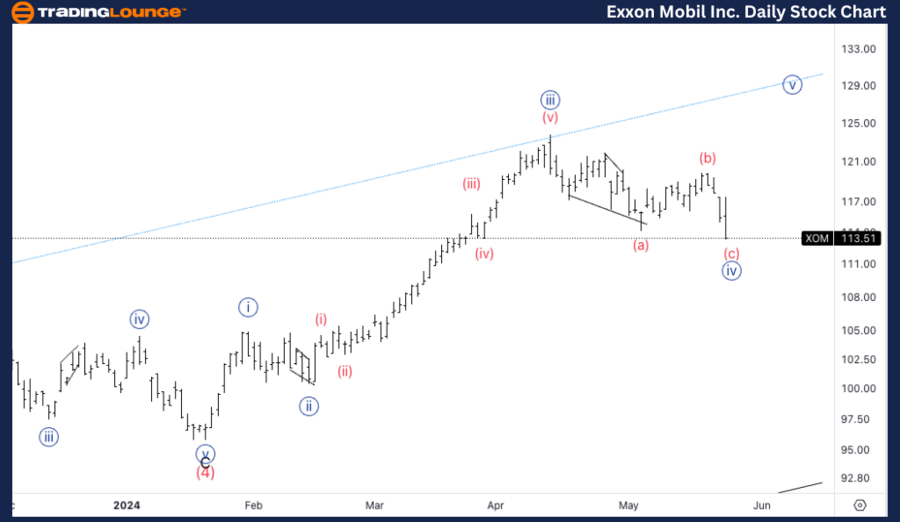
XOM Elliott Wave Analysis Trading Lounge Daily Chart,

Exxon Mobil Inc. (XOM) Daily Chart Analysis

XOM Elliott Wave Technical Analysis

Function: Counter Trend

Mode: Corrective

Structure: ZigZag

Position: Wave {iv} of 1

Direction: Bottom in wave {iv}

Details: XOM is correcting deeper than anticipated in wave {iv}, but a potential upward turn is possible as we approach the $110 mark.

On the daily chart, XOM is in a corrective phase, specifically a ZigZag pattern. This pattern is part of wave {iv} of 1, indicating a counter-trend movement. The correction is deeper than initially expected, but signs point to a possible reversal as we near $110. This level is crucial for traders to watch, as it may signal the end of the corrective phase and the beginning of a new upward trend

Exxon-Mobil-Inc-1D-s...


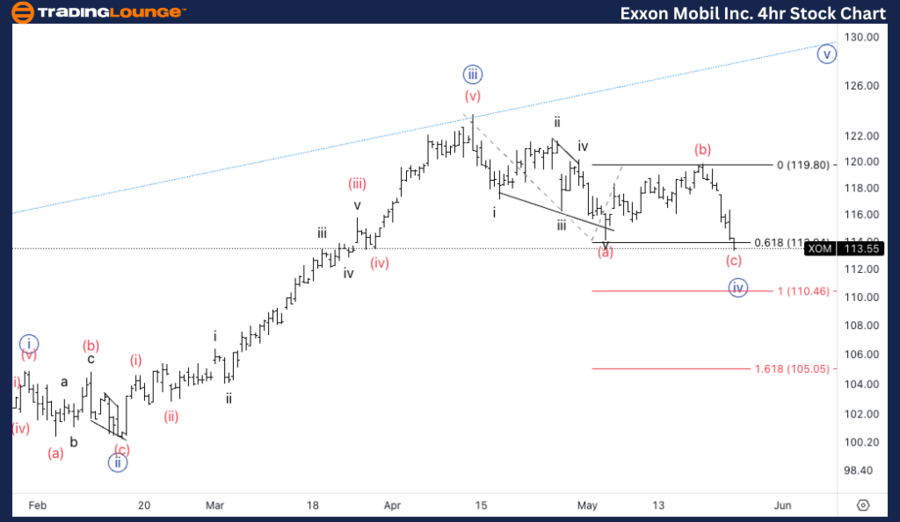
XOM Elliott Wave Analysis Trading Lounge 4H Chart,

Exxon Mobil Inc. (XOM) 4H Chart Analysis

XOM Elliott Wave Technical Analysis

Function: Counter Trend

Mode: Corrective

Structure: ZigZag

Position: Wave (c) of {ii}

Direction: Bottom in wave (c)

Details: XOM is at 0.618 (c) vs. (a). We anticipate a turn soon, with the next target being the equality of (c) vs. (a) at $110.

The 4-hour chart provides a more granular view of XOM's price movements. Here, we observe a ZigZag pattern in wave (c) of {ii}. The price is currently at 0.618 (c) vs. (a), a critical Fibonacci retracement level. This suggests a potential turning point soon, with the next target being the equality of (c) vs. (a) at $110

Technical Analyst: Malik Awais

Source: visit Tradinglounge.com and learn From the Experts Join TradingLounge Here 

See Previous: NVIDIA Corp. (NVDA) Stocks Elliott Wave Technical Analysis

Special Trial Offer - 0.76 Cents a Day for 3 Months! Click here

Access 7 Analysts Over 170 Markets Covered. Chat Room With Support

Exxon-Mobil-Inc-4Hr-...

Related

Cocoa Market Forecast 2024: Elliott Wave Technical Analysis, Trends, and Trading Opportunities

Cocoa Market Forecast 2024: Elliott Wave Technical Analysis, Trends, and Trading Opportunities

This analysis delves into the 2024 cocoa market using Elliott Wave theory. It highlights recent pric...

Read More >
ITC LTD Stock Elliott Wave Technical Analysis: Stay Updated on ITC investment Outlook and Trading Strategies

ITC LTD Stock Elliott Wave Technical Analysis: Stay Updated on ITC investment Outlook and Trading Strategies

This comprehensive analysis of ITC Ltd utilizes Elliott Wave Theory to assess stock trends and price...

Read More >
Forex Analysis of Euro/U.S. Dollar EURUSD Using Elliott Wave Theory Provides Insights into the Current Market Trends

Forex Analysis of Euro/U.S. Dollar EURUSD Using Elliott Wave Theory Provides Insights into the Current Market Trends

This detailed analysis of EURUSD using Elliott Wave Theory provides insights into the current market...

Read More >
LINKUSD Elliott Wave Analysis Showing Chainlink Wave 2 Correction and Setup for Potential Wave 3 Breakout Above Resistance

LINKUSD Elliott Wave Analysis Showing Chainlink Wave 2 Correction and Setup for Potential Wave 3 Breakout Above Resistance

This LINKUSD Elliott Wave analysis offers a technical breakdown of Chainlink’s corrective Wave 2 an...

Read More >
DOTUSD Elliott Wave Technical Analysis: Polkadot Price Prediction, Technical Forecast, Fibonacci Retracement, and Trading Strategies

DOTUSD Elliott Wave Technical Analysis: Polkadot Price Prediction, Technical Forecast, Fibonacci Retracement, and Trading Strategies

DOT/USD with this comprehensive Elliott Wave analysis. Understand the Polkadot corrective wave struc...

Read More >
Theta Token/U.S. dollar(THETAUSD) Elliott Wave Technical Analysis 10 November 23

Theta Token/U.S. dollar(THETAUSD) Elliott Wave Technical Analysis 10 November 23

Theta Token/U.S. dollar(THETAUSD) Elliott Wave Technical Analysis 10 November 23 indicating an uptre...

Read More >

$1 for 2 Weeks

then $29 a month!

What a Special Offer!

Trade Recommendations

Unleash the power of deversified trading with our comprehensive portfolio, covering 250+ markets:

  • Stock Trades
  • Crypto Trades
  • Forex Trades
  • Commodity Trades
Elliott Wave Analysis

Gain a competitive edge with expert insights and AI-powered Elliott Wave charting into:

  • Global Indices
  • US Stocks & ASX Stocks
  • Forex & Crypto
  • Commodities
Top-Notch Trading Tools

Equip yourself with the tools of success:

  • Real-time Chat rooms
  • Elliott Wave Algorithm
  • Portfolio tools
  • TradingLevels
  • Screener
  • Trading Game
7 Elliott Wave Analysts

Stay ahead of the market with daily charts and insightful videos
Your secret to strategic trading!

JOIN HERE


Welcome to TradingLounge (ASIC A.R.No. 321187), specialists in trades, trading education and technical analysis, covering stocks, indices, commodities, forex and cryptocurrencies.

When you join TradingLounge you have access to everything we offer, including trade tools, educational content and a social platform to chat with like-minded investors.

Read more

@Copyright 2024 by tradinglounge.com

Contact Us

Australian no: 02 4787 6020

International no: +61 (2) 47876020

Pay with:

Find us on