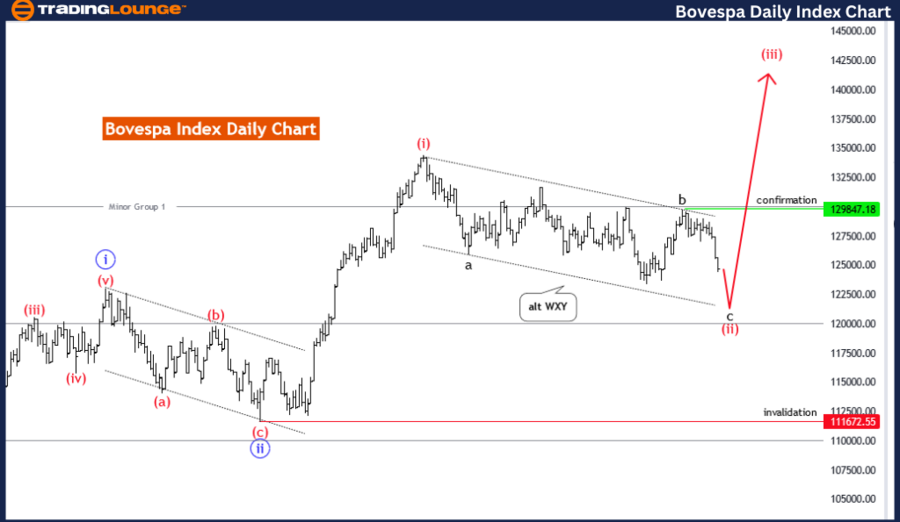
Bovespa Index Elliott Wave Analysis – Day Chart Analysis
Bovespa Index Elliott Wave Technical Analysis
FUNCTION: Trend
MODE: Corrective
STRUCTURE: Red wave 2
POSITION: Blue Wave 3
DIRECTION NEXT HIGHER DEGREES: Red wave 3
DETAILS: Red wave 2 of 3 is still in play and nearing completion.
Wave Cancel Invalid Level: 111672.55
The Bovespa Index Elliott Wave analysis on the day chart provides a detailed examination of the market using Elliott Wave theory to predict future price movements. The primary function identified in this analysis is a trend, which suggests that the market's current movements are part of a larger, predictable pattern that can be analyzed to forecast future directions.
The mode of the market movement is corrective, indicating that the market is in a phase of adjustment or retracement. Specifically, the structure under analysis is red wave 2, which is part of a broader corrective pattern within the ongoing trend.
Currently, the market is positioned in blue wave 3, meaning it is in the third wave of a more extensive five-wave sequence. This position signifies that the market is undergoing a significant phase of movement, often involving considerable price changes.
Looking to the next higher degrees, the analysis forecasts a transition to red wave 3 after the completion of the current corrective phase (red wave 2). This indicates that after the correction, the market is expected to resume its primary trend with an impulsive wave, typically characterized by strong and decisive price movements.
The details of the analysis highlight that red wave 2 of 3 is still in play and appears to be nearing its end. This means that the market is in the final stages of its corrective phase before it resumes the primary trend direction with red wave 3.
A crucial aspect of this analysis is the wave cancel invalid level, set at a specific point. This level acts as a critical threshold; if the market price drops below this point, it would invalidate the current wave count and necessitate a reassessment of the wave structure and market projections. Monitoring this level is essential to confirm the validity of the wave pattern and ensure accurate predictions.
In summary, the Bovespa Index on the day chart is currently in a corrective phase within red wave 2 of a larger trend. The market is expected to complete this correction soon before transitioning to red wave 3, marking a return to the primary trend. The wave cancel invalid level is a key point to watch to validate the current analysis and future forecasts.

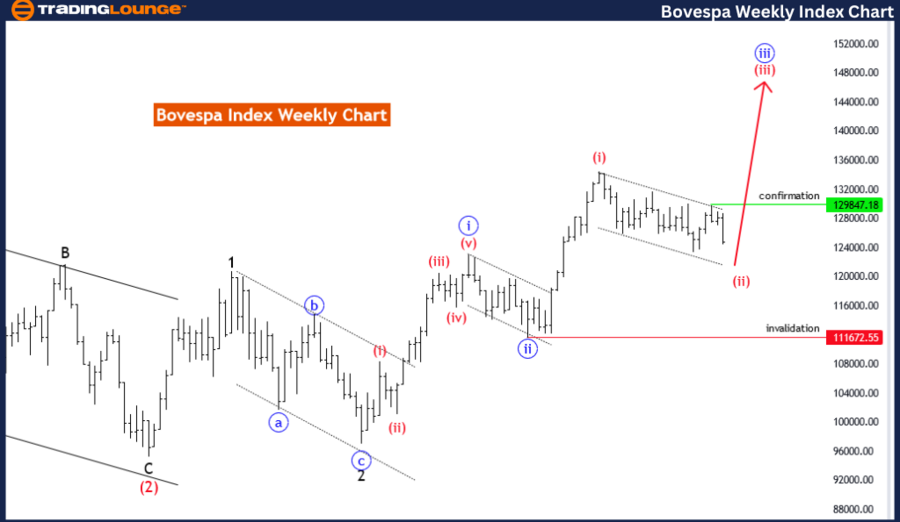
Bovespa Index Elliott Wave Analysis – Weekly Chart Analysis
Bovespa Index Elliott Wave Technical Analysis
FUNCTION: Trend
MODE: Corrective
STRUCTURE: Red wave 2
POSITION: Blue wave 3
DIRECTION NEXT HIGHER DEGREES: Red wave 3
DETAILS: Red wave 2 of 3 is still in play and nearing completion.
Wave Cancel Invalid Level: 111672.55
The Bovespa Index Elliott Wave analysis on the weekly chart provides insights into the market's behaviour using Elliott Wave theory, which is useful for forecasting future price movements based on historical patterns. The analysis identifies the current function as a trend, indicating that the market is in a phase where prices follow a recognizable and predictable pattern.
The mode of this trend is corrective, meaning the market is undergoing a phase of adjustment or consolidation after a prior movement. The specific structure under examination is red wave 2, which represents a corrective wave within the broader trend framework.
At present, the market is positioned in blue wave 3, a significant stage in the wave cycle that typically involves notable price movements and sets the stage for subsequent phases. This positioning within blue wave 3 suggests that the market is in the midst of a complex corrective pattern.
Looking to the next higher degrees, the analysis projects a transition to red wave 3 following the completion of the current corrective phase. This projection implies that after the red wave 2 correction concludes, the market will resume its primary trend direction with red wave 3, usually marked by more decisive and substantial price actions.
The analysis details that red wave 2 of 3 is still active and appears to be nearing its completion. This observation indicates that the corrective phase is in its final stages and the market is preparing to transition into the next impulsive wave, red wave 3. This upcoming wave is expected to align with the primary trend direction, bringing more significant movements.
A critical component of the analysis is the wave cancel invalid level, set at a specific market price. This level serves as a benchmark for validating the current wave structure. If the market price falls below this threshold, it would invalidate the existing wave count and require a reassessment of the wave analysis and market outlook. Monitoring this level is essential for maintaining the accuracy of the wave pattern and the reliability of future predictions.
In summary, the Bovespa Index on the weekly chart is in a corrective phase within red wave 2 of a larger trend. This corrective phase is close to ending, after which the market is expected to resume its primary trend with red wave 3. The wave cancel invalid level is a crucial point to watch for confirming the validity of the current analysis and ensuring accurate future projections.
Technical Analyst: Malik Awais
Source: visit Tradinglounge.com and learn From the Experts Join TradingLounge Here
See previous: IBEX 35 (Spain) Elliott Wave Analysis
Special Trial Offer - 0.76 Cents a Day for 3 Months! Click here
Access 7 Analysts Over 170 Markets Covered. Chat Room With Support
