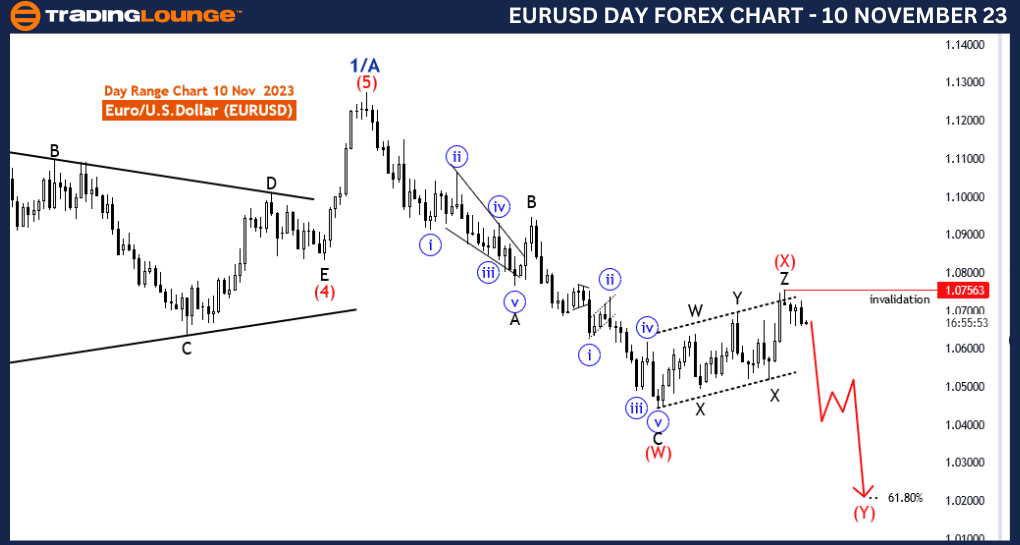
EURUSD Elliott Wave Analysis Trading Lounge Day Chart, 10 November 23
Euro/U.S.Dollar(EURUSD) Day Chart
EURUSD Elliott Wave Technical Analysis
Function: Counter Trend
Mode: corrective
Structure:Z of X
Position: wave 2/B
Direction Next lower Degrees: Red wave Y(started)
Details: black wave Z of red wave X looking completed at 1.07563. Now looking for red wave Y of 2/B. Wave Cancel invalid level: 1.07563
The "EURUSD Elliott Wave Analysis Trading Lounge Day Chart" dated 10 November 23, offers a detailed examination of the Euro/U.S. Dollar (EURUSD) currency pair on a daily timeframe. Utilizing Elliott Wave analysis, the report aims to provide traders with insights into potential price movements, particularly focusing on the dynamics of medium to long-term trends.
Identifying the market's "Function" as "Counter Trend" implies that the current price movement is against the prevailing trend. This information is crucial for traders as it suggests a potential reversal or correction in the market.
Characterizing the "Mode" as "Corrective" indicates that the market is likely undergoing a temporary price correction rather than a sustained trend. Corrective phases often precede or follow impulsive waves, offering traders opportunities to position themselves for potential trend resumptions.
The "Structure" is identified as "Z of X," suggesting that the market is in the final phase of a complex correction. "Z" waves in Elliott Wave theory typically represent the terminal part of a correction.
The "Position" is recognized as "wave 2/B," indicating a critical point within the corrective structure. "B" waves are often counter trend movements within a correction, signaling a potential reversal.
In terms of the "Direction Next lower Degrees," the analysis indicates "Red wave Y (started)," suggesting that the broader trend might be resuming after the completion of the current corrective structure.
The detailed aspect of "Details" mentions that "black wave Z of red wave X" is potentially completed at 1.07563. The analysis is now looking for "red wave Y of 2/B," which implies anticipation of the next wave in the corrective structure.
The "Wave Cancel invalid level" is highlighted at 1.07563. A breach of this level might indicate a shift in the anticipated market structure, prompting traders to reevaluate their positions.
In conclusion, the EURUSD Elliott Wave Analysis on the Day Chart suggests a Counter Trend scenario with a Corrective Mode, specifically in the final phase of a complex correction (Z of X). Traders should closely monitor confirmation and invalidation levels for well-informed decision-making.
Technical Analyst : Malik Awais
Source : Tradinglounge.com get trial here!

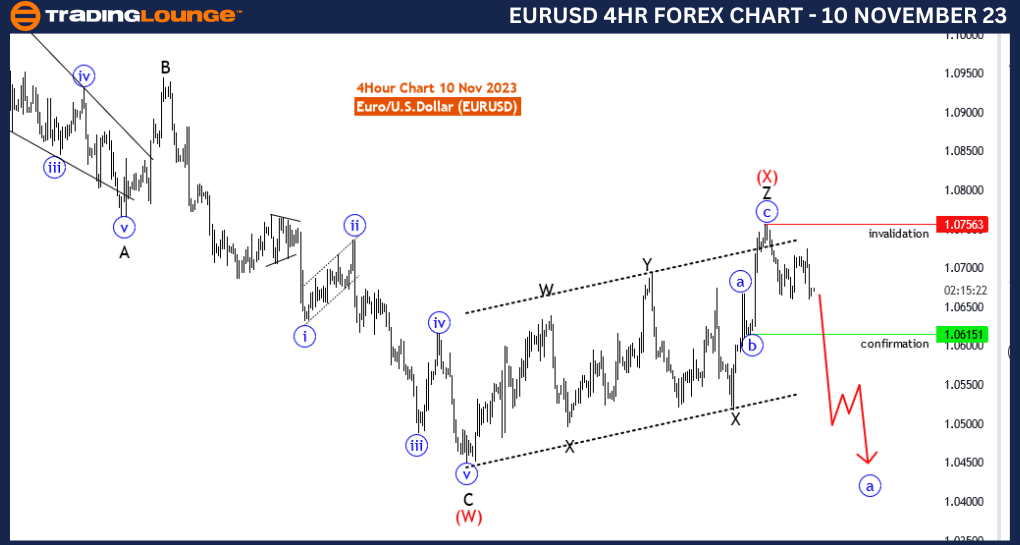
EURUSD Elliott Wave Analysis Trading Lounge 4 Hour Chart, 10 November 23
Euro/U.S.Dollar(EURUSD) 4 Hour Chart
EURUSD Elliott Wave Technical Analysis
Function: Counter Trend
Mode: corrective
Structure:Z of X
Position: wave 2/B
Direction Next lower Degrees: Red wave Y(started)
Details: black wave Z of red wave X looking completed at 1.07563. Confirmation level for A of Y: 1.06151 . Wave Cancel invalid level: 1.07563
The "EURUSD Elliott Wave Analysis Trading Lounge 4 Hour Chart" dated 10 November 23, furnishes a comprehensive overview of the Euro/U.S. Dollar (EURUSD) currency pair. Employing Elliott Wave theory, the analysis provides key insights into potential market movements, catering particularly to traders aiming to navigate short to medium-term fluctuations.
The analysis identifies the market's "Function" as "Counter Trend," indicating that the current price movement is contrary to the prevailing trend. This information is pivotal for traders seeking opportunities in counter trend movements.
Characterizing the "Mode" as "Corrective" implies that the market is undergoing a temporary price correction rather than a sustained trend. This is vital information for traders, as corrective phases often precede the continuation of the dominant trend.
The "Structure" is identified as "Z of X," indicating that the market is likely within the final phase of a complex correction. In Elliott Wave terms, "Z" waves are often associated with the termination of complex corrections.
The "Position" is recognized as "wave 2/B," signifying a critical point within the corrective structure. "B" waves typically represent counter trend movements within a correction, preceding the final wave.
In the "Direction Next lower Degrees," the analysis mentions "Red wave Y (started)," suggesting that the broader trend might be resuming after the completion of the current corrective structure.
The detailed aspect of "Details" indicates that "black wave Z of red wave X" is possibly completed at 1.07563. It provides a confirmation level for "A of Y" at 1.06151. These levels are significant as they offer specific points for traders to confirm or invalidate the current wave count.
The "Wave Cancel invalid level" is highlighted at 1.07563, suggesting that a breach of this level might indicate a shift in the anticipated market structure.
In conclusion, the EURUSD Elliott Wave Analysis on the 4 Hour Chart suggests a Counter Trend scenario with a Corrective Mode, specifically in the final phase of a complex correction (Z of X). Traders should be attentive to confirmation and invalidation levels as provided in the analysis for informed decision-making.
Technical Analyst : Malik Awais
Source : Tradinglounge.com get trial here!
