22Jul

Commodity Coffee Elliott Wave Technical Analysis: Examined to Offer Valuable Insights for both short-term and long-term trading strategies

TradingLounge Coffee Commodity Elliott Wave Analysis

Function: Counter-Trend

Mode: Correction

Structure: Double zigzag for wave Y (circled).

Position: Wave C of (W)

Direction: Wave C is still in progress

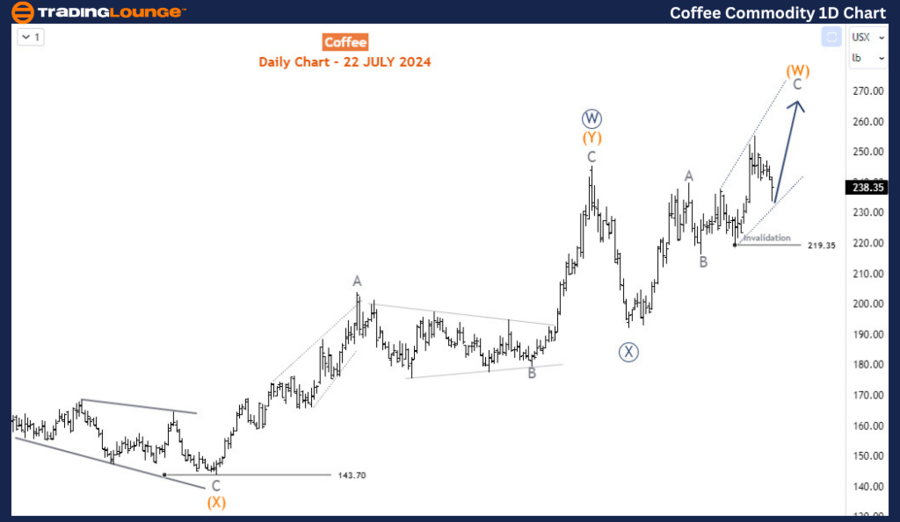
Details: The commodity still favors the upside to complete wave C of (W) toward 261.35-278.5 where another pullback may begin.

Coffee Elliott Wave Technical Analysis - Recent Market Developments

The recent developments in the Coffee market suggest a continuation of the bullish trend that began in January 2023. Since resuming this bullish sequence on May 6, 2024, Coffee has closed every month from March 2024 in the green and appears set to do the same in July. The coming months could see Coffee prices surpass the February 2022 high, reaching levels not seen since September 2011.

Long-Term Structure Analysis

The long-term structure indicates that Coffee completed a bearish cycle between May 2011 and May 2019. The recovery starting from May 2019 could complete either an impulse wave or another corrective structure. Projections suggest that Coffee prices should reach $315, which is over 32% higher than the current price. The ongoing recovery saw its 1st and 2nd legs complete in May 2022 and February 2022 and January 2023, respectively, labeled as wave x-y of the cycle degree. The current leg is considered wave x of the cycle degree, with a target of $315.

Coffee Daily Chart Analysis

On the daily chart, it is observed that wave x (cycle degree) might complete a W-X-Y (circled) pattern of the primary degree. Waves W and X have already been completed, and the price is currently advancing in wave Y (circled). Wave Y could also develop into a three-wave structure, indicating that the price is presently in wave C of (W) of Y (circled). Wave C of (W) is evolving into an expanding diagonal structure, reflecting the bullish momentum.
Coffee-Commodity-1D-...


Coffee H4 Chart Analysis

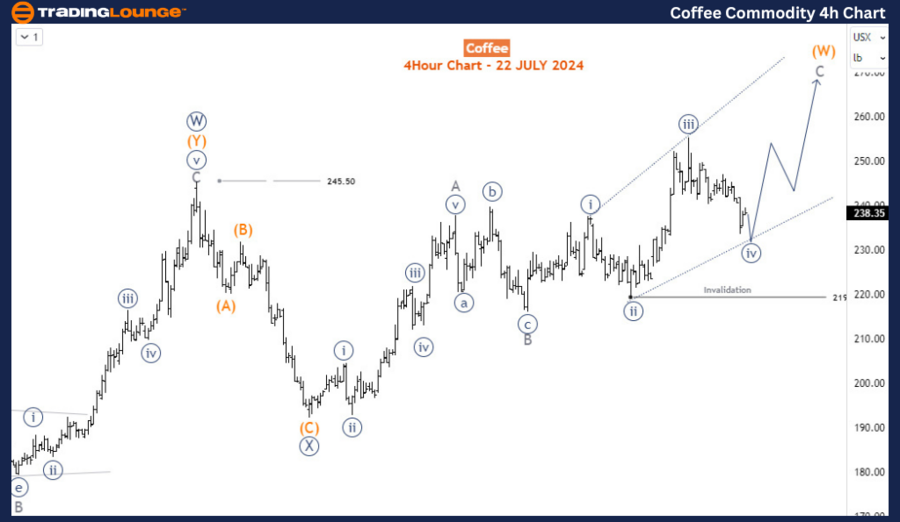
The H4 chart shows that wave C is nearing the completion of its 4th sub-wave. As long as support is maintained above 219.35, an extension higher to the 260-270 range is expected, completing wave (W) before the next pullback for wave (X) begins. This support level is crucial for maintaining the bullish outlook and achieving the projected targets.

Summary

In summary, the Elliott Wave analysis suggests that Coffee is in the midst of a robust bullish trend, with the potential to reach $315 in the near term. Key levels to watch include the support at 219.35 and the target range of 260-270 for the completion of wave (W). The long-term structure and current wave patterns indicate a continuation of the upward momentum, providing valuable insights for both short-term and long-term trading strategies. This analysis underscores the importance of closely monitoring wave structures and key price levels to anticipate future movements in the Coffee market.

Technical Analyst: Sanmi Adeagbo

Source: visit Tradinglounge.com and learn From the Experts Join TradingLounge Here 

See Previous: Cocoa Elliott Wave Technical Analysis

Special Trial Offer - 0.76 Cents a Day for 3 Months! Click here

Access 7 Analysts Over 170 Markets Covered. Chat Room With Support
Coffee-Commodity-4h-...

Related

Bitcoin / U.S. dollar(BTCUSD) Elliott Wave Technical Analysis 13 November 23

Bitcoin / U.S. dollar(BTCUSD) Elliott Wave Technical Analysis 13 November 23

Bitcoin/U.S. dollar(BTCUSD) Elliott Wave Technical Analysis on 13 November 23 with BTCUSD Analysis D...

Read More >
Understand Soybean Commodity Market with the Corrective Phase and Forecasted Price Targets Using Elliott Wave Technical Analysis

Understand Soybean Commodity Market with the Corrective Phase and Forecasted Price Targets Using Elliott Wave Technical Analysis

Explore an in-depth Elliott Wave analysis of Soybean prices, providing key insights into current mar...

Read More >
Euro/British Pound(EURGBP) 4 Hour Chart EURGBP Elliott Wave Technical Analysis 13 October 23

Euro/British Pound(EURGBP) 4 Hour Chart EURGBP Elliott Wave Technical Analysis 13 October 23

The EUR/GBP Elliott Wave Analysis for 13 October 23, serves as a valuable guide for traders and inve...

Read More >
Insights for Traders on ChainLink's Price Movement, Trading Strategies and Technical Indicators: LINKUSD Elliott Wave Analysis

Insights for Traders on ChainLink's Price Movement, Trading Strategies and Technical Indicators: LINKUSD Elliott Wave Analysis

This detailed analysis covers ChainLink (LINKUSD) price prediction using Elliott Wave theory, focusi...

Read More >
EURUSD Daily and 4-hour Charts: Euro/U.S.Dollar (EURUSD) Forex Elliott Wave Technical Analysis

EURUSD Daily and 4-hour Charts: Euro/U.S.Dollar (EURUSD) Forex Elliott Wave Technical Analysis

This article provides an in-depth EURUSD Elliott Wave analysis, focusing on current trends, forecast...

Read More >
Northern Star Resources NST Elliott Wave Technical Analysis to Help Guide Your Investment Decisions in the ASX Market

Northern Star Resources NST Elliott Wave Technical Analysis to Help Guide Your Investment Decisions in the ASX Market

Our detailed Elliott Wave analysis of Northern Star Resources (NST.ASX) highlights current market tr...

Read More >

Buy 1 Month

Get 3 Months!

Special Offer:

Trade Recommendations

Unleash the power of deversified trading with our comprehensive portfolio, covering:

  • Stock Trades
  • Crypto Trades
  • Forex Trades
  • Commodity Trades
Elliott Wave Analysis

Gain a competive edge with expert insights in to:

  • Global Indices
  • US Stocks & ASX Stocks
  • Forex & Crypto
  • Commodities
Top-Notch Trading Tools

Equip yourself with the tools of success:

  • Social Chat
  • Elliott Wave Algorithm
  • Screener
  • TradingLevels
  • Trading Game
7 Elliott Wave Analysts

Stay ahead of the market with daily charts and insightful videos
-Your secret to strategic trading!

JOIN HERE


Welcome to TradingLounge (ASIC A.R.No. 321187), specialists in trades, trading education and technical analysis, covering stocks, indices, commodities, forex and cryptocurrencies.

When you join TradingLounge you have access to everything we offer, including trade tools, educational content and a social platform to chat with like-minded investors.

Read more

@Copyright 2024 by tradinglounge.com

Contact Us

Australian no: 02 4787 6020

International no: +61 (2) 47876020

Pay with:

Find us on