Johnson & Johnson (JNJ) Elliott Wave Analysis: TrandingLounge Daily Chart

This Elliott Wave analysis for Johnson & Johnson (JNJ) provides a detailed overview of the stock's trend direction and potential price movements on both the daily and 1-hour charts. This analysis is essential for traders aiming to grasp the market structure and identify potential trading opportunities.

JNJ Elliott Wave Technical Analysis

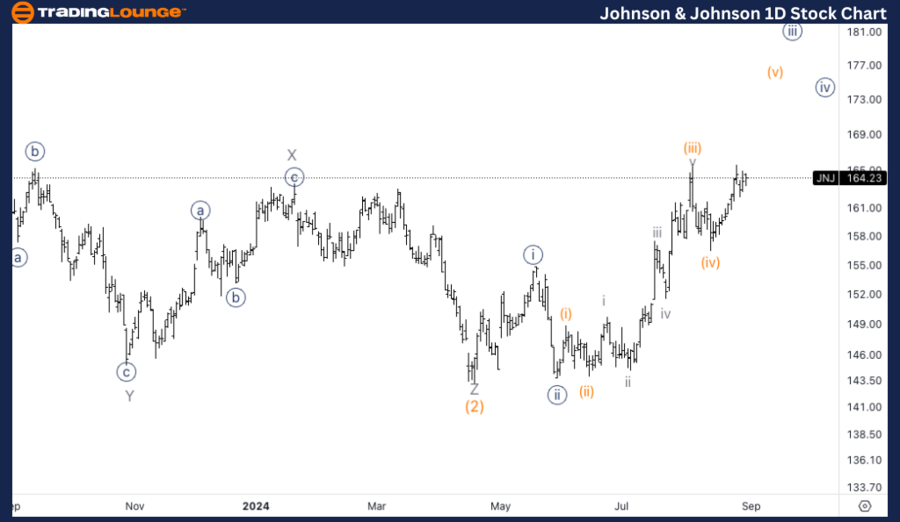
Johnson & Johnson (JNJ) Daily Chart Analysis

Function: Trend

Mode: Impulsive

Structure: Motive

Position: Wave {iii} of 1

Direction: Upside into wave 1

Details: A top in wave {iii} is anticipated soon, as the subdivision appears to have completed a five-wave move within {iii}.

JNJ Elliott Wave Technical Analysis – Daily Chart

Johnson & Johnson (JNJ) seems to be approaching the latter stages of wave {iii} of 1. The structure indicates a five-wave subdivision within wave {iii}, suggesting that this wave might be nearing its completion. Once wave {iii} concludes, a corrective wave {iv} is expected before further upside momentum continues in wave {v}.

Johnson-&-Johnson-1D...


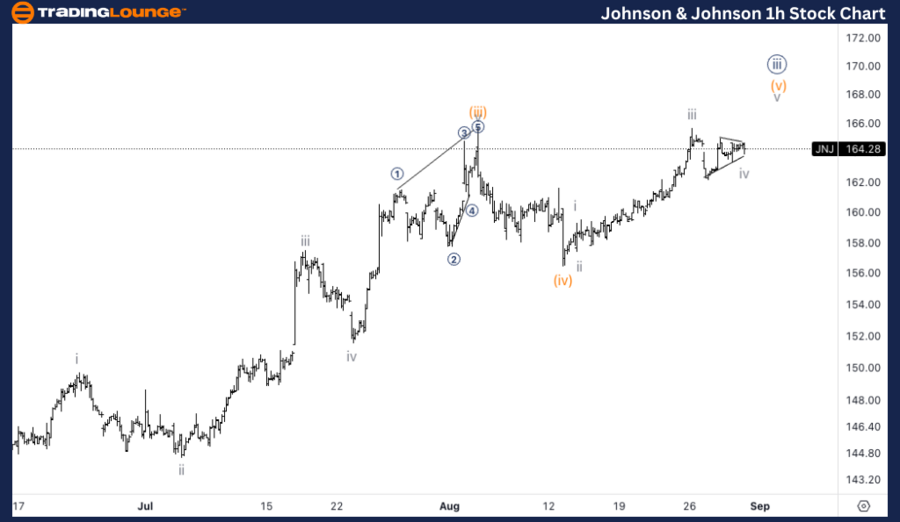
JNJ Elliott Wave Analysis: 1-Hour Chart Overview

Johnson & Johnson (JNJ) 1-Hour Chart Analysis

JNJ Stock Technical Analysis

Function: Trend

Mode: Impulsive

Structure: Motive

Position: Wave (v) of {iii}

Direction: Upside in wave v of (v)

Details: A triangle pattern in wave iv suggests a potential upside in wave v during today's session, with the price developing just below the $165 level.

JNJ Elliott Wave Technical Analysis – 1H Chart

The 1-hour chart indicates that Johnson & Johnson (JNJ) is within wave (v) of {iii}. A triangle pattern seems to be forming in wave iv, which typically signals consolidation before the final upward move. This pattern implies that JNJ might experience further upside in wave v of (v), with a potential break above the $165 level during today's trading session.

Technical Analyst: Alessio Barretta

Source: visit Tradinglounge.com and learn From the Experts Join TradingLounge Here 

See Previous: PayPal Elliott Wave Technical Analysis

Special Trial Offer - 0.76 Cents a Day for 3 Months! Click here

Access 7 Analysts Over 200 Markets Covered. Chat Room With Support

Johnson-&-Johnson-1h...

Related

XRP/U.S. dollar(XRPUSD) Elliott Wave Technical Analysis 13 December 23

XRP/U.S. dollar(XRPUSD) Elliott Wave Technical Analysis 13 December 23

XRP/U.S. dollar(XRPUSD) Elliott Wave Technical Analysis dated 13 December 23, with day chart and 4-h...

Read More >
JEPQ ETF Elliott Wave Analysis Predicts Strong Nasdaq Premium Income Rally, Key Breakout, and Strategic Trading Opportunities

JEPQ ETF Elliott Wave Analysis Predicts Strong Nasdaq Premium Income Rally, Key Breakout, and Strategic Trading Opportunities

JEPQ ETF Elliott Wave technical analysis shows a strong rally ahead, key breakout levels, support zo...

Read More >
Comprehensive EURUSD Elliott Wave Technical Analysis: Forecast, Trading Strategy, and Key Market Insights

Comprehensive EURUSD Elliott Wave Technical Analysis: Forecast, Trading Strategy, and Key Market Insights

Our detailed EURUSD Elliott Wave analysis highlights the ongoing corrective phase within Navy Blue W...

Read More >
Vanguard Australian Shares: V300AEQ ETF UNITS – VAS Stock Analysis & VAS Elliott Wave Technical Forecast

Vanguard Australian Shares: V300AEQ ETF UNITS – VAS Stock Analysis & VAS Elliott Wave Technical Forecast

This article provides an in-depth Elliott Wave analysis of ASX: V300AEQ ETF UNITS - VAS, highlightin...

Read More >
Strategic insights for traders on Bitcoin Crypto Price News Today Elliott Wave Technical Analysis

Strategic insights for traders on Bitcoin Crypto Price News Today Elliott Wave Technical Analysis

In this article, we provide a comprehensive BTCUSD Elliott Wave analysis focusing on Bitcoin's p...

Read More >
NIFTY 50 (INDIA) Index Elliott Wave Technical Analysis: Daily & Weekly Market Trends and Forecasts

NIFTY 50 (INDIA) Index Elliott Wave Technical Analysis: Daily & Weekly Market Trends and Forecasts

This analysis provides a comprehensive view of NIFTY 50 using Elliott Wave theory. Covering both dai...

Read More >

Buy 1 Month

Get 3 Months!

Special Offer:

Trade Recommendations

Unleash the power of deversified trading with our comprehensive portfolio, covering:

  • Stock Trades
  • Crypto Trades
  • Forex Trades
  • Commodity Trades
Elliott Wave Analysis

Gain a competive edge with expert insights in to:

  • Global Indices
  • US Stocks & ASX Stocks
  • Forex & Crypto
  • Commodities
Top-Notch Trading Tools

Equip yourself with the tools of success:

  • Social Chat
  • Elliott Wave Algorithm
  • Screener
  • TradingLevels
  • Trading Game
7 Elliott Wave Analysts

Stay ahead of the market with daily charts and insightful videos
-Your secret to strategic trading!

JOIN HERE


Welcome to TradingLounge (ASIC A.R.No. 321187), specialists in trades, trading education and technical analysis, covering stocks, indices, commodities, forex and cryptocurrencies.

When you join TradingLounge you have access to everything we offer, including trade tools, educational content and a social platform to chat with like-minded investors.

Read more

@Copyright 2024 by tradinglounge.com

Contact Us

Australian no: 02 4787 6020

International no: +61 (2) 47876020

Pay with:

Find us on