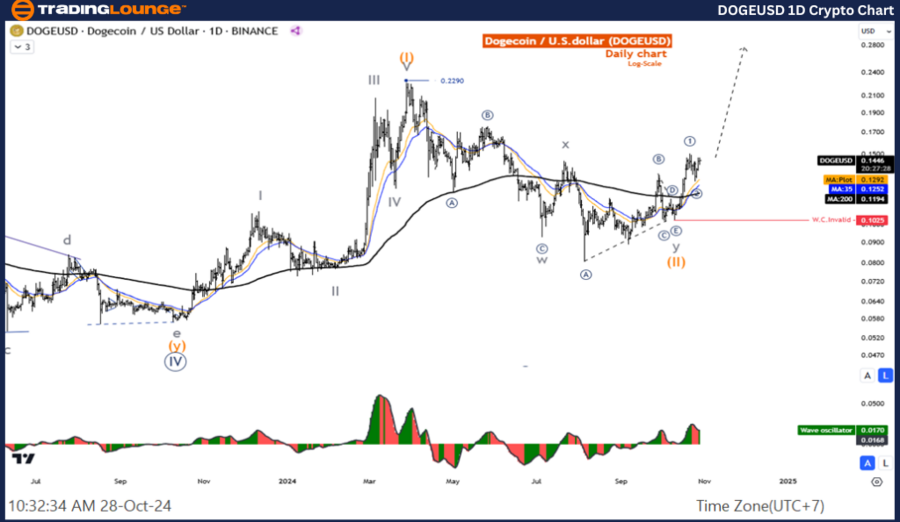
DOGEUSD Elliott Wave Analysis - TradingLounge Daily Chart

Dogecoin (DOGE) vs. U.S. Dollar (DOGEUSD)

DOGEUSD Elliott Wave Technical Analysis

Function: Counter Trend

Mode: Corrective

Structure: Triple Corrective

Position: Wave Z

Direction (Higher Degree): Wave (II) of Impulse

Invalidation Level: Wave Cancel Invalid Level

Details: Wave (II) is projected to complete, and the price is rising, initiating wave (III) with potential bullish momentum.

Dogecoin (DOGE) Trading Strategy

The corrective structure in wave II seems to have concluded, indicating focus on the potential five-wave rally of wave III. With the price action signaling an uptrend, traders may consider re-entry points aligned with this upward movement.

Dogecoin (DOGE) Technical Indicators

  • Moving Average (MA200): Price is positioned above the MA200, reinforcing the uptrend.

  • Wave Oscillator: Reflects bullish momentum, suggesting a favorable environment for upward moves.

DOGEUSD-1D-Crypto-Ch...


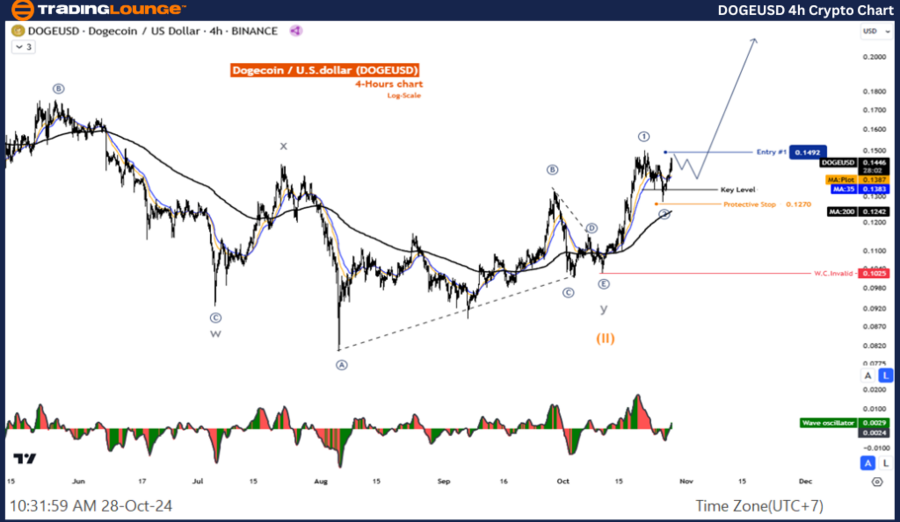
XRPUSD Elliott Wave Analysis - TradingLounge 4-Hour Chart

Dogecoin (DOGE) vs. U.S. Dollar (DOGEUSD)

DOGEUSD Technical Analysis

Function: Counter Trend

Mode: Corrective

Structure: Triple Corrective

Position: Wave Z

Direction (Higher Degree): Wave (II) of Impulse

Invalidation Level: Wave Cancel Invalid Level

Details: Wave (II) appears near completion, and price movement is inclining toward wave (III) with potential for continuation.

Dogecoin (DOGE) Trading Strategy

Wave II’s correction phase seems to have concluded, directing attention toward wave III's five-wave rally. The ongoing uptrend suggests identifying re-entry points that align with anticipated upward momentum.

Dogecoin (DOGE) Technical Indicators

  • Moving Average (MA200): The price remains above MA200, confirming an uptrend.

  • Wave Oscillator: Indicates bullish momentum, favoring upward price action.

Technical Analyst:  Kittiampon Somboonsod

Source: visit Tradinglounge.com and learn From the Experts Join TradingLounge Here See

Previous: Bitcoin/U.S. Dollar (BTCUSD) Elliott Wave Technical Analysis

VALUE Offer - Buy 1 Month & Get 3 Months!Click here

Access 7 Analysts Over 200 Markets Covered. Chat Room With Support

DOGEUSD-4h-Crypto-Ch...

Related

Gold Market Analysis: Gold (XAUUSD) Commodity Elliott Wave Technical Analysis and Optimal Entry Points for Long Positions

Gold Market Analysis: Gold (XAUUSD) Commodity Elliott Wave Technical Analysis and Optimal Entry Points for Long Positions

This article provides a detailed Elliott Wave technical analysis of gold, focusing on the bullish tr...

Read More >
Polkadot/U.S. dollar(DOTUSD) Elliott Wave Technical Analysis 1 February 24

Polkadot/U.S. dollar(DOTUSD) Elliott Wave Technical Analysis 1 February 24

TradingLounge Polkadot technical analysis today using Polkadot/US dollar(DOTUSD) Elliott Wave Analys...

Read More >
NEWMONT CORPORATION (ASX:NEM) Elliott Wave Technical Analysis – Stock Price Prediction, Support & Resistance Levels for Investors

NEWMONT CORPORATION (ASX:NEM) Elliott Wave Technical Analysis – Stock Price Prediction, Support & Resistance Levels for Investors

Elliott Wave technical analysis of NEWMONT CORPORATION (ASX: NEM), highlighting potential price move...

Read More >
NFLX Elliott Wave Analysis: Minor Wave 1 Top Confirmed, Bears Gaining Momentum 6 February 24

NFLX Elliott Wave Analysis: Minor Wave 1 Top Confirmed, Bears Gaining Momentum 6 February 24

Elliott Wave analysis delves into Netflix Inc.'s (NFLX) current market dynamics dated 6 February...

Read More >
ASX LIMITED Analysis: Unlock Elliott Wave Insights, Stock Forecasts, Key Levels, and Smarter Trading Strategies for Market Success

ASX LIMITED Analysis: Unlock Elliott Wave Insights, Stock Forecasts, Key Levels, and Smarter Trading Strategies for Market Success

Stay ahead with ASX Limited Elliott Wave Analysis. Our comprehensive technical forecast includes key...

Read More >
Elliott Wave Techniacl Analysis for Berkshire Hathaway Inc. (BRK:B): Daily and 1-Hour Chart Insights to Predict Stock Price Movements

Elliott Wave Techniacl Analysis for Berkshire Hathaway Inc. (BRK:B): Daily and 1-Hour Chart Insights to Predict Stock Price Movements

Elliott Wave analysis examines the daily and 1-hour charts of Berkshire Hathaway (BRK.B) and Visa In...

Read More >

Buy 1 Month

Get 3 Months!

Special Offer:

Trade Recommendations

Unleash the power of deversified trading with our comprehensive portfolio, covering:

  • Stock Trades
  • Crypto Trades
  • Forex Trades
  • Commodity Trades
Elliott Wave Analysis

Gain a competive edge with expert insights in to:

  • Global Indices
  • US Stocks & ASX Stocks
  • Forex & Crypto
  • Commodities
Top-Notch Trading Tools

Equip yourself with the tools of success:

  • Social Chat
  • Elliott Wave Algorithm
  • Screener
  • TradingLevels
  • Trading Game
7 Elliott Wave Analysts

Stay ahead of the market with daily charts and insightful videos
-Your secret to strategic trading!

JOIN HERE


Welcome to TradingLounge (ASIC A.R.No. 321187), specialists in trades, trading education and technical analysis, covering stocks, indices, commodities, forex and cryptocurrencies.

When you join TradingLounge you have access to everything we offer, including trade tools, educational content and a social platform to chat with like-minded investors.

Read more

@Copyright 2024 by tradinglounge.com

Contact Us

Australian no: 02 4787 6020

International no: +61 (2) 47876020

Pay with:

Find us on