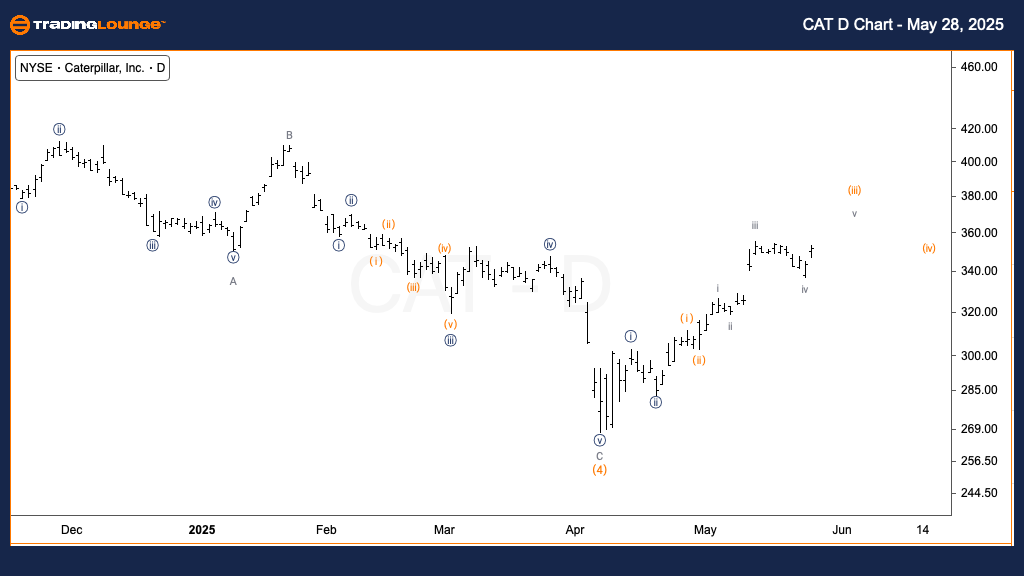
CAT Elliott Wave Analysis | Trading Lounge Daily Chart Insights
Caterpillar Inc. (CAT) Daily Chart Analysis
CAT Elliott Wave Technical Analysis
Function: Trend
Mode: Motive
Structure: Impulsive
Position: Wave (iii) of {iii}
Direction: Bullish continuation within wave {iii}
Details: A breakout above $350 indicates the start of Minute wave {iii}, targeting higher price levels.
CAT Elliott Wave Analysis – Daily Chart
Caterpillar Inc. (CAT) exhibits strong bullish momentum, with price action decisively moving above the critical $350 resistance level. This upward move is aligned with the impulsive nature of Minute wave {iii}, which supports a broader trend continuation. Sustained gains above recent swing highs would reinforce this bullish Elliott Wave count, pointing to further upside potential.
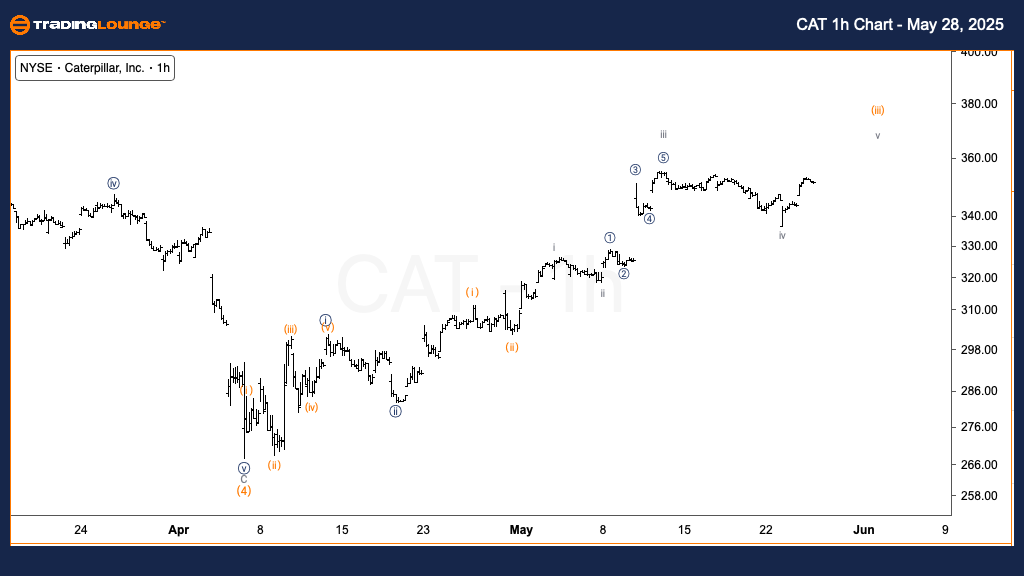
CAT Elliott Wave Analysis | Trading Lounge 1h Chart Insights
Caterpillar Inc. (CAT) 1-Hour Chart Analysis
CAT Elliott Wave Technical Analysis
Function: Trend
Mode: Motive
Structure: Impulsive
Position: Wave v of (iii)
Direction: Upward movement within wave v
Details: Anticipating further upside as subminuette wave v extends to complete Minuette wave (iii).
CAT Elliott Wave Analysis – 1-Hour Chart
The 1-hour Elliott Wave structure for CAT suggests the stock is nearing the completion of subminuette wave v within Minuette wave (iii). This scenario implies a final surge in price before a corrective wave (iv) unfolds. Traders should monitor resistance zones closely, as these could cap the current impulsive advance and mark a pivot for the next wave phase.
Technical Analyst: Alessio Barretta
Source: Visit Tradinglounge.com and learn from the Experts. Join TradingLounge Here
Previous: FTNT Elliott Wave Technical Analysis
VALUE Offer - Buy 1 Month & Get 3 Months!Click here
Access 7 Analysts Over 200 Markets Covered. Chat Room With Support