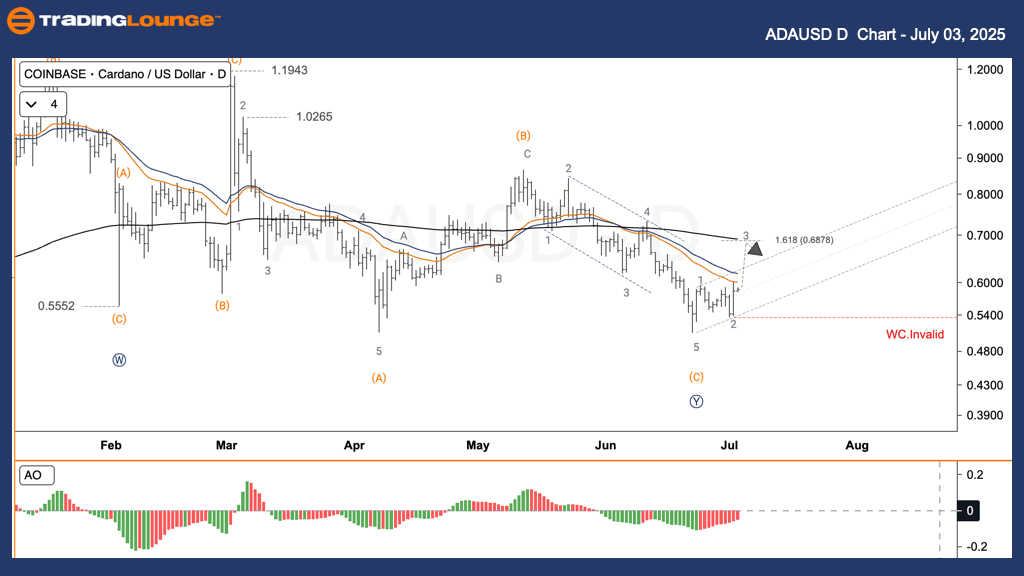
Cardano / U.S. Dollar (ADAUSD) Elliott Wave Analysis – TradingLounge Daily Chart
ADAUSD Elliott Wave Technical Forecast
Function: Follow Trend
Mode: Motive
Structure: Impulse
Position: Wave 2
Next Higher Degree Direction: Developing Wave 3
Wave Invalid Level: Not defined
The daily ADAUSD chart confirms completion of Wave 1 and Wave 2 within a bullish Elliott Wave impulse structure. Wave 2 pulled back near the key Fibonacci 0.618 level around $0.543, marking a strong retracement zone. Currently, Wave 3 appears to be forming, with a projected 1.618 Fibonacci extension target of approximately $0.685 based on Wave 1’s length.
Cardano Trading Strategy – Daily Timeframe
✅ Short-Term Swing Traders:
- Look for long entry points on dips.
- Use a stop loss slightly below $0.511.
🟥 Important: A drop below $0.511 invalidates the near-term bullish outlook, requiring strategy reassessment.
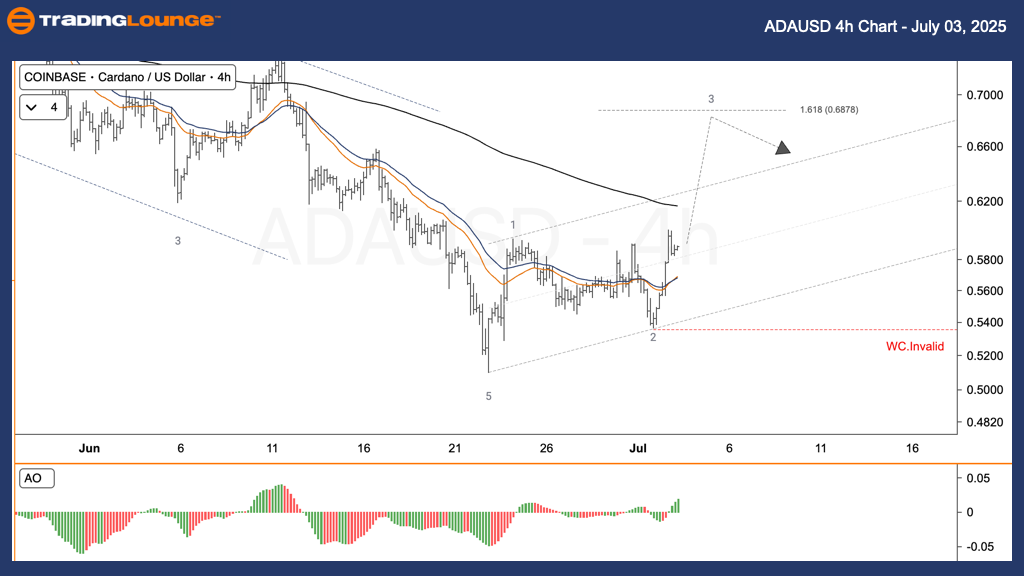
Cardano / U.S. Dollar (ADAUSD) Elliott Wave Analysis – TradingLounge 4H Chart
ADAUSD Elliott Wave Technical Forecast
Function: Follow Trend
Mode: Motive
Structure: Impulse
Position: Wave 2
Next Higher Degree Direction: Developing Wave 3
Wave Invalid Level: Not defined
The 4-hour chart supports the daily Elliott Wave outlook. Wave 1 and Wave 2 are completed, with Wave 2 retracing to the Fibonacci 0.618 level at $0.543. Currently, a bullish Wave 3 is developing, targeting the 1.618 Fibonacci extension near $0.685.
Cardano Trading Strategy – 4H Timeframe
✅ Swing Trading Perspective:
- Consider entering during retracements.
- Stop loss should be maintained below $0.511 for risk control.
🟥 Caution: A breach below $0.511 challenges the bullish scenario, suggesting a need for re-evaluation.
Technical Analyst: Kittiampon Somboonsod, CEWA
Source: Visit Tradinglounge.com and learn from the Experts. Join TradingLounge Here
Previous: THETAUSD Elliott Wave Technical Analysis
VALUE Offer - Buy 1 Month & Get 3 Months!Click here
Access 7 Analysts Over 200 Markets Covered. Chat Room With Support