06Mar

Wheat Elliott Wave Technical Analysis: Navigating the Bearish Trend Towards a Potential Reversal

Wheat Elliott Wave Analysis - bearish trend in the final stage

Wheat Elliott Wave Technical Analysis

Function - Counter-trend

Mode - Corrective

Structure - Zigzag

Position - Blue wave b of black wave Y

Direction - Downwards for Blue Wave c of black wave Y

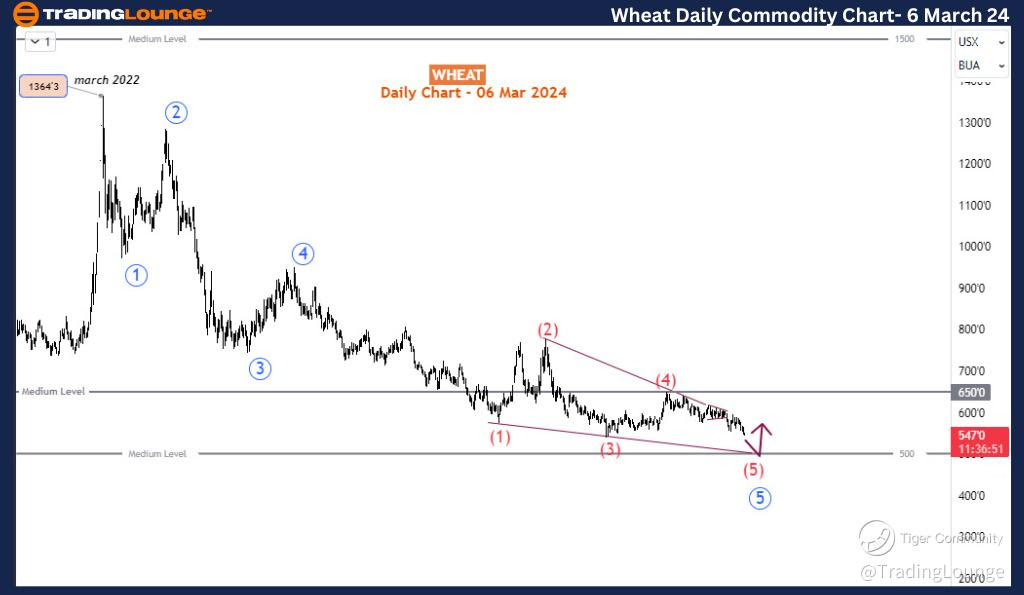
Wheat's recent price movements have underscored a persistent downward trend that has gripped the market since 2022. However, amidst this bearish momentum, indications suggest that we might be approaching a pivotal juncture. The breach below a crucial support level, notably around $553, signifies a potential turning point for traders. This development hints at the possibility of a significant bullish correction looming around the $500 mark.

Analyzing the Elliott wave perspective provides further clarity on this scenario. The daily timeframe reveals a distinct pattern of a bearish impulse wave originating from 1363 in March 2022. This impulse wave, delineated by the sequence 1-2-3-4-5 (circled in blue), appears to be reaching its terminal phase. The fifth wave exhibits characteristics of an ending diagonal, denoted as wave (5), indicating an imminent shift in market sentiment. As per Elliott wave theory, a forthcoming 3-wave bullish correction is anticipated, potentially initiating a rally that could surpass previous bounces observed during the two-year downtrend.

Wheat-Day-Commodity-...


Gold (XAUUSD) 4Hr Chart Analysis

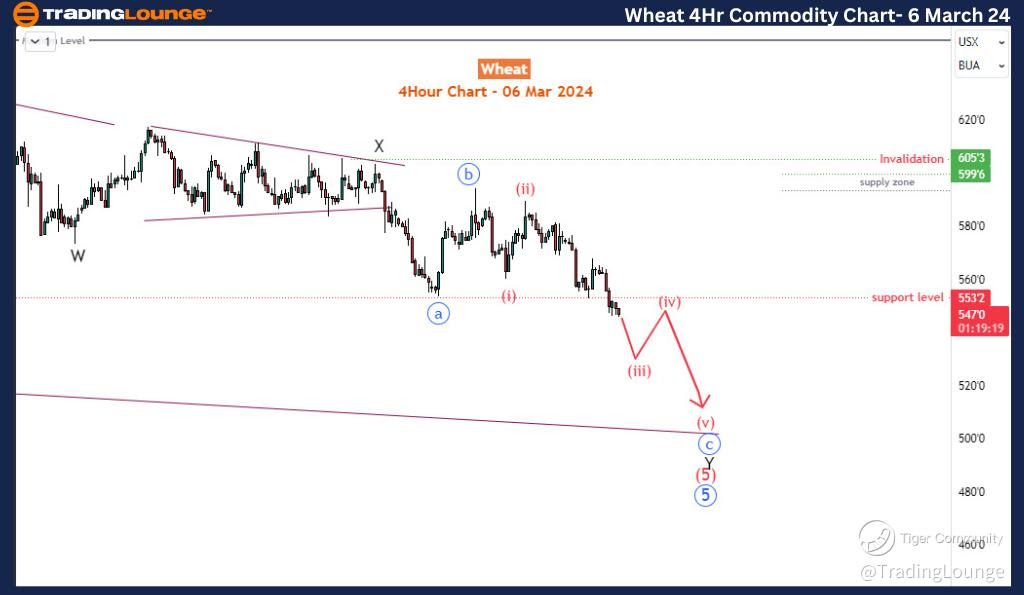
Zooming into the H4 chart unveils the sub-wave structure of wave (5). Commencing at the pivotal 650 level, where wave (4) concluded, wave (5) unfolds into a double zigzag pattern. Wave X of (5) terminated at 605, marked by a triangular formation, while sub-wave 'a' (in blue) concluded at 553. This sets the stage for the subsequent corrective wave 'b,' with the ongoing wave 'c' exhibiting a distinct downward trajectory. Further downside movement towards the 500-510 zone is anticipated from this point.

In summary, the exhaustive two-year bearish trend in Wheat appears to be approaching its climax, with the final leg gravitating toward the $500 threshold. Traders should remain vigilant for potential opportunities as a substantial bullish correction is poised to unfold, potentially signaling a paradigm shift in market dynamics.

Technical Analyst: Sanmi Adeagbo

Source: visit Tradinglounge.com and learn From the Experts Join TradingLounge Here 

See Previous: Gold (XAUUSD)

TradingLounge Once Off SPECIAL DEAL: Here > 1 month Get 3 months.   

Wheat-4Hr-Commodity-...


Related

Bitcoin/U.S. dollar(BTCUSD) Elliott Wave Technical Analysis 31 October 23

Bitcoin/U.S. dollar(BTCUSD) Elliott Wave Technical Analysis 31 October 23

Bitcoin/U.S. dollar(BTCUSD) Elliott Wave Technical Analysis on 31 October 23 with BTCUSD Analysis Da...

Read More >
Highlights Significant Price Targets In the Upcoming Waves: Silver (XAGUSD) Commodity Elliott Wave Technical Analysis

Highlights Significant Price Targets In the Upcoming Waves: Silver (XAGUSD) Commodity Elliott Wave Technical Analysis

Our detailed silver market analysis utilizes Elliott Wave theory to forecast potential price movemen...

Read More >
S&P 500 ELLIOTT WAVE ANALYSIS, 27 JAN 2022

S&P 500 ELLIOTT WAVE ANALYSIS, 27 JAN 2022

S&P500 Overview: The 4100 is the 38.2% retracement level for the SP500. Trading Strategies: Hold sho...

Read More >
Elliott Wave Analysis: In-Depth Insights for S&P 500, NASDAQ 100, Russell 2000, DAX 40, FTSE 100 & ASX 200

Elliott Wave Analysis: In-Depth Insights for S&P 500, NASDAQ 100, Russell 2000, DAX 40, FTSE 100 & ASX 200

Unlock the power of Elliott Wave Analysis with our detailed examination of major global indices, inc...

Read More >
Asian Paints Stock Forecast Using Elliott Wave: Impulsive Rally Nearing Completion, Expect Reversal and Trading Opportunities Soon

Asian Paints Stock Forecast Using Elliott Wave: Impulsive Rally Nearing Completion, Expect Reversal and Trading Opportunities Soon

Asian Paints is advancing in an impulsive Elliott Wave structure, nearing the final leg of a counter...

Read More >
"Elliott Wave Analysis: NASDAQ 100, SP500, and Top Tech Stocks - Trading Strategies and Market Forecast"

"Elliott Wave Analysis: NASDAQ 100, SP500, and Top Tech Stocks - Trading Strategies and Market Forecast"

This analysis covers the Elliott Wave patterns for NASDAQ 100, SP500, and major tech stocks like App...

Read More >

$1 for 2 Weeks

then $29 a month!

What a Special Offer!

Trade Recommendations

Unleash the power of deversified trading with our comprehensive portfolio, covering 250+ markets:

  • Stock Trades
  • Crypto Trades
  • Forex Trades
  • Commodity Trades
Elliott Wave Analysis

Gain a competitive edge with expert insights and AI-powered Elliott Wave charting into:

  • Global Indices
  • US Stocks & ASX Stocks
  • Forex & Crypto
  • Commodities
Top-Notch Trading Tools

Equip yourself with the tools of success:

  • Real-time Chat rooms
  • Elliott Wave Algorithm
  • Portfolio tools
  • TradingLevels
  • Screener
  • Trading Game
7 Elliott Wave Analysts

Stay ahead of the market with daily charts and insightful videos
Your secret to strategic trading!

JOIN HERE


Welcome to TradingLounge (ASIC A.R.No. 321187), specialists in trades, trading education and technical analysis, covering stocks, indices, commodities, forex and cryptocurrencies.

When you join TradingLounge you have access to everything we offer, including trade tools, educational content and a social platform to chat with like-minded investors.

Read more

@Copyright 2024 by tradinglounge.com

Contact Us

Australian no: 02 4787 6020

International no: +61 (2) 47876020

Pay with:

Find us on