15Mar

Opportunities for traders to strategically capitalize: Binance coin/ U.S. dollar (BNBUSD) Elliott Wave Technical Analysis

BNBUSD Elliott Wave Analysis TradingLounge Daily Chart.

In today's Elliott Wave analysis, we delve into the Binance coin/U.S. dollar (BNBUSD) pair, uncovering insights to help traders navigate the market effectively. BNBUSD chart presents an intriguing opportunity for traders to capitalize on the ongoing uptrend.

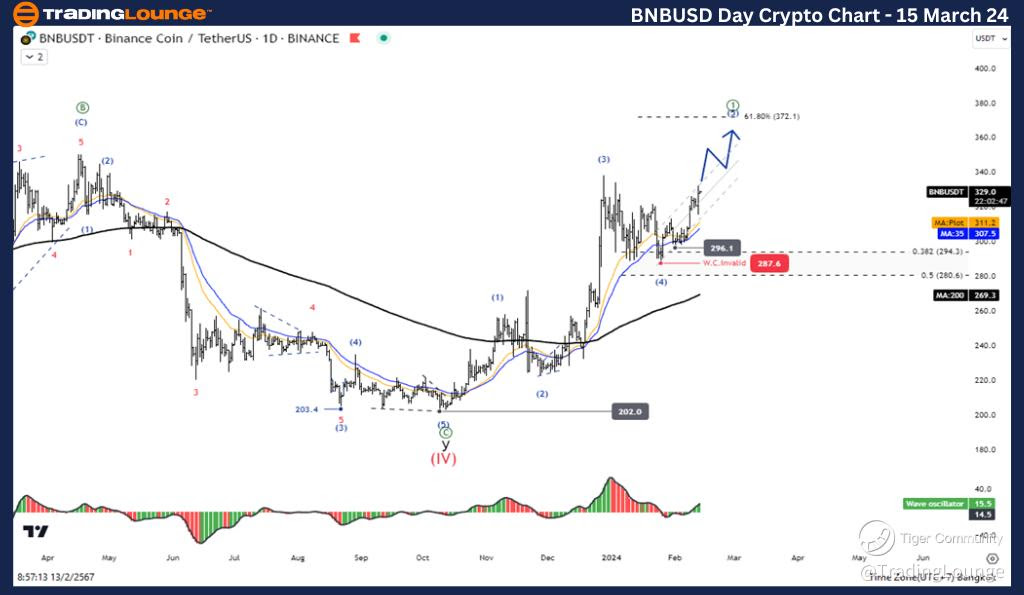
Binance coin/ U.S. dollar(BNBUSD) Daily Chart Analysis

BNBUSD Elliott Wave Analysis on Daily Chart

BNBUSD Elliott Wave Technical Analysis

Function: Follow Trend

Mode: Motive

Structure: Impulse

Position: Wave 3

Direction Next higher Degrees: Wave (3)

Wave Cancel invalid level: 287.5

As per Elliott Wave theory, BNBUSD is currently positioned within Wave 3, indicating a strong bullish sentiment in the market. Wave 3, being an impulse wave, signifies a powerful move in the direction of the prevailing trend. Notably, Wave 3 equals 261.8% of Wave 1 at 592.8, suggesting considerable momentum in the uptrend.

BNBUSD Trading Strategy:
With BNBUSD still entrenched in an uptrend, traders have an opportunity to capitalize on potential further upside. Wave 3's internal sub-waves are yet to be completed, indicating the likelihood of continued upward movement. There exists a chance to test the 717.0 level, presenting potential profit-taking opportunities for astute traders.

BNBUSD Technical Indicators:

  • Price above the MA200: Indicates a sustained uptrend.
  • Wave Oscillator: Shows bullish momentum, further supporting the upward bias in BNBUSD.

BNBUSD-day-Crypto-ch...


TradingLounge Elliott Wave Analysis of BNBUSD

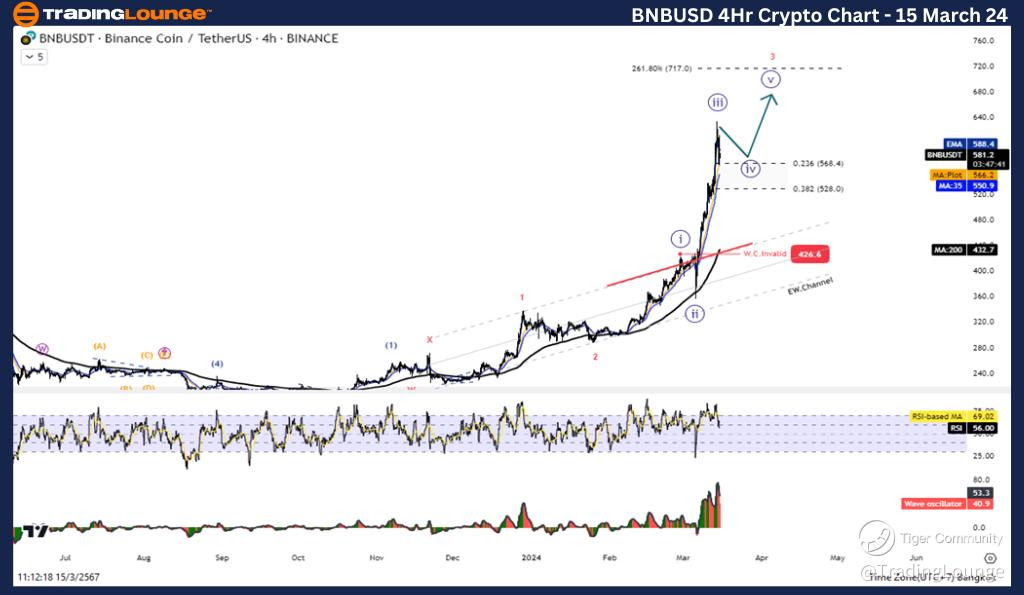
Binacecoin/ U.S. dollar(BNBUSD) 4H Chart Analysis

BNBUSD Elliott Wave Technical Analysis

BNBUSD Elliott Wave Analysis on 4H Chart

Function: Follow Trend

Mode: Motive

Structure: Impulse

Position: Wave 3

Direction Next higher Degrees: Wave (3)

Wave Cancel invalid level: 287.5

Upon closer examination of the 4-hour chart, BNBUSD continues to exhibit characteristics of Wave 3, maintaining bullish momentum in the market. However, there are indications that Wave 3 may be nearing completion, with prices potentially correcting in Wave 4.

Binacecoin/ U.S. dollar(BNBUSD) Trading Strategy:
Despite the possibility of Wave 3 completion, BNBUSD remains within an overarching uptrend. Traders can still capitalize on potential upward movements, particularly as Wave 3 unfolds. Testing the 717.0 level remains a viable scenario, offering traders additional profit opportunities.

Binacecoin/ U.S. dollar(BNBUSD) Technical Indicators:

  • Price above the MA200: Reinforces the prevailing uptrend.
  • Wave Oscillator: Indicates bullish momentum, aligning with the overall bullish outlook for BNBUSD.

Conclusion

In conclusion, the Elliott Wave analysis of BNBUSD suggests a favourable environment for traders seeking to ride the trend for profitable outcomes. With Wave 3 still in play, there exists ample opportunity for further upward movement, presenting traders with favourable risk-to-reward ratios. By aligning trading strategies with the prevailing Elliott Wave structure and leveraging technical indicators, traders can navigate the BNBUSD market with confidence, aiming for successful trades amidst the ongoing uptrend.

Technical Analyst: Kittiampon Somboonsod, CEWA

Source: visit Tradinglounge.com and learn From the Experts Join TradingLounge Here 

See Previous: Dogecoin/ U.S. dollar(DOGEUSD) 

TradingLounge Once Off SPECIAL DEAL: Here > 1 month Get 3 months

BNBUSD-4Hr-Crypto-ch...

Related

ASX Trading Success: REA GROUP LTD – REA Stock Analysis & Elliott Wave Technical Forecast

ASX Trading Success: REA GROUP LTD – REA Stock Analysis & Elliott Wave Technical Forecast

This article provides an in-depth Elliott Wave analysis of REA Group Ltd on the Australian Stock Exc...

Read More >
NIFTY 50 (India) Elliott Wave Technical Analysis: Insights into Corrective Waves, Invalidation Levels, and Key Market Trends for Traders

NIFTY 50 (India) Elliott Wave Technical Analysis: Insights into Corrective Waves, Invalidation Levels, and Key Market Trends for Traders

Get a comprehensive overview of NIFTY 50 Elliott Wave analysis, covering daily and weekly chart insi...

Read More >
Explore the latest Elliott Wave analysis for ASX LNW: LIGHT & WONDER INC ASX Trading Success

Explore the latest Elliott Wave analysis for ASX LNW: LIGHT & WONDER INC ASX Trading Success

Explore the latest Elliott Wave analysis for ASX LNW (LIGHT & WONDER INC.). Our expert insights offe...

Read More >
U.S. Dollar / Canadian Dollar Elliott Wave Technical Analysis: Navigate the Current Market Structure of USDCAD Effectively

U.S. Dollar / Canadian Dollar Elliott Wave Technical Analysis: Navigate the Current Market Structure of USDCAD Effectively

This article provides an in-depth Elliott Wave analysis of the USDCAD currency pair. With insights o...

Read More >
Stay informed with our expert insights: Visa Inc. (V) Stocks Elliott Wave Technical Analysis

Stay informed with our expert insights: Visa Inc. (V) Stocks Elliott Wave Technical Analysis

Get the latest Elliott Wave analysis for Visa Inc. (V) as of June 13, 2024. Our detailed review cove...

Read More >
McDonald’s Corp.(MCD) Elliott Wave Technical Analysis: Unveiling Trading Opportunities

McDonald’s Corp.(MCD) Elliott Wave Technical Analysis: Unveiling Trading Opportunities

McDonald’s Corp. (MCD) shows bullish momentum on the daily chart, with resistance at $300 and a pot...

Read More >

Buy 1 Month

Get 3 Months!

Special Offer:

Trade Recommendations

Unleash the power of deversified trading with our comprehensive portfolio, covering:

  • Stock Trades
  • Crypto Trades
  • Forex Trades
  • Commodity Trades
Elliott Wave Analysis

Gain a competive edge with expert insights in to:

  • Global Indices
  • US Stocks & ASX Stocks
  • Forex & Crypto
  • Commodities
Top-Notch Trading Tools

Equip yourself with the tools of success:

  • Social Chat
  • Elliott Wave Algorithm
  • Screener
  • TradingLevels
  • Trading Game
7 Elliott Wave Analysts

Stay ahead of the market with daily charts and insightful videos
-Your secret to strategic trading!

JOIN HERE


Welcome to TradingLounge (ASIC A.R.No. 321187), specialists in trades, trading education and technical analysis, covering stocks, indices, commodities, forex and cryptocurrencies.

When you join TradingLounge you have access to everything we offer, including trade tools, educational content and a social platform to chat with like-minded investors.

Read more

@Copyright 2024 by tradinglounge.com

Contact Us

Australian no: 02 4787 6020

International no: +61 (2) 47876020

Pay with:

Find us on