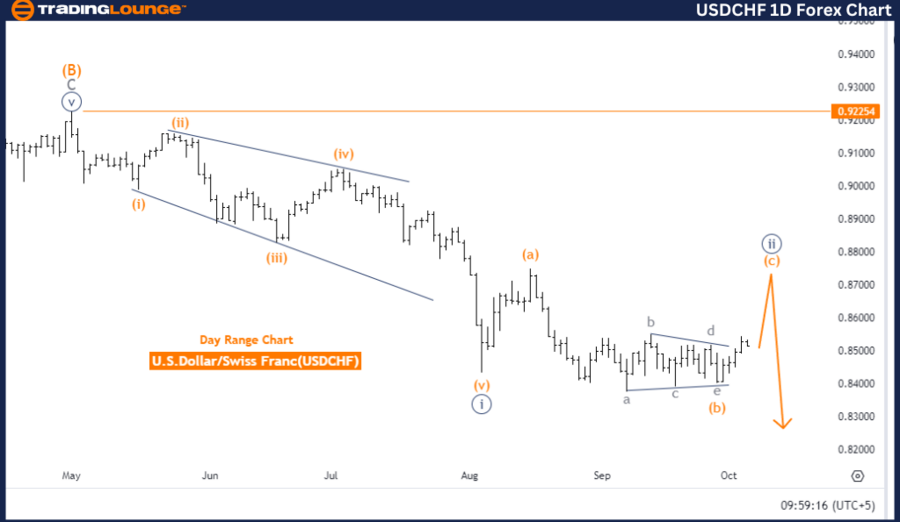
USDCHF Elliott Wave Analysis Trading Lounge Day Chart
U.S. Dollar/Swiss Franc (USDCHF) Day Chart
USDCHF Elliott Wave Technical Analysis
Function: Counter Trend
Mode: Impulsive
Structure: Orange wave C
Position: Navy blue wave 2
Direction Next Lower Degrees: Navy blue wave 3
Details: Navy blue wave 1 appears completed, with orange wave C of navy blue wave 2 currently forming.
Wave Cancel Invalidation Level: 0.92254
The USDCHF Elliott Wave Analysis on the daily chart indicates a counter-trend correction within an impulsive mode. This suggests that despite being in a corrective phase, the market is showing strong momentum. The primary focus is on orange wave C, which is part of the larger navy blue wave 2.
At this point, navy blue wave 1 has already completed, and the market is currently developing orange wave C within navy blue wave 2. According to Elliott Wave Theory, wave C often concludes the corrective cycle, indicating that once wave C finishes, the market could revert to the main trend.
The next critical movement expected is navy blue wave 3, which typically represents the strongest and most powerful wave in an impulsive sequence. This suggests a potential for significant upward momentum following the end of the correction.
The wave cancel invalidation level is set at 0.92254. If the market falls below this level, the current Elliott Wave analysis will be invalidated, and a new market structure will need to be considered. This level acts as a key reference point for confirming the ongoing correction.
Summary
The USDCHF Elliott Wave Analysis for the daily chart highlights a corrective phase, with orange wave C of navy blue wave 2 currently forming. Traders should monitor the invalidation level at 0.92254 to confirm the corrective structure. After the completion of navy blue wave 2, navy blue wave 3 is expected to lead the market back to the primary trend with stronger momentum.
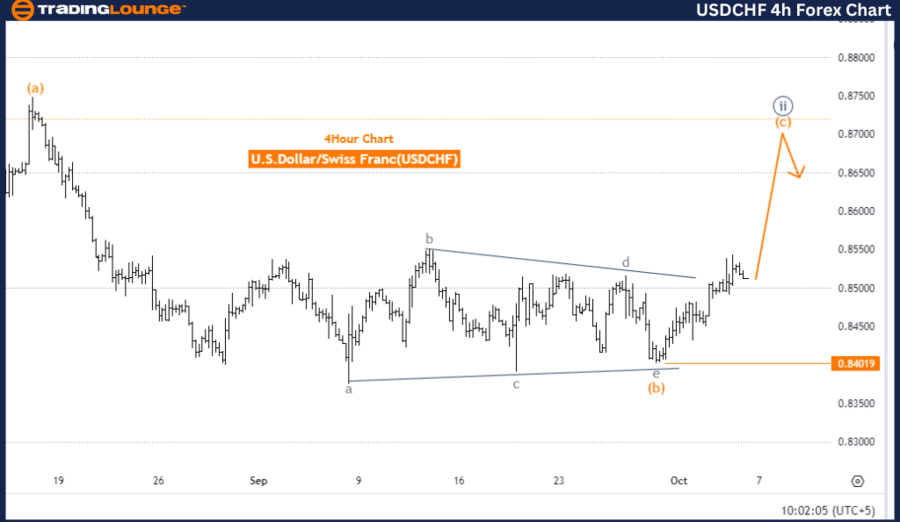
U.S. Dollar/Swiss Franc (USDCHF) 4 Hour Chart
USDCHF Elliott Wave Technical Analysis
Function: Counter Trend
Mode: Impulsive
Structure: Orange wave C
Position: Navy blue wave 2
Direction Next Lower Degrees: Navy blue wave 3
Details: Navy blue wave 1 appears completed, with orange wave C of navy blue wave 2 currently forming.
Wave Cancel Invalidation Level: 0.84019
The USDCHF Elliott Wave Analysis for the 4-hour chart reflects a counter-trend movement, signaling a correction against the dominant trend. The market remains in an impulsive mode, indicating a strong structural advance despite being corrective. The current focus is on orange wave C, which is part of the broader navy blue wave 2.
At this stage, navy blue wave 1 is completed, and the market is currently forming orange wave C within navy blue wave 2. In Elliott Wave Theory, wave C usually concludes the corrective process, leading to a potential shift back to the primary trend.
The next anticipated movement is navy blue wave 3, which typically marks the most substantial wave in an impulsive series. This wave is expected to bring a powerful resurgence in the market’s primary trend after the corrective phase ends.
The wave cancel invalidation level to watch is 0.84019. If the market drops below this level, the current Elliott Wave analysis will no longer be valid, requiring a reassessment of the wave structure. Monitoring this level is critical for confirming the ongoing correction phase.
Summary
The USDCHF Elliott Wave Analysis for the 4-hour chart indicates that the market is in a corrective phase, with orange wave C of navy blue wave 2 in progress. Traders should watch the invalidation level at 0.84019 to verify the continuation of the correction. After navy blue wave 2 concludes, navy blue wave 3 is expected to take over, driving the market back into the primary trend with stronger momentum.
Technical Analyst: Malik Awais
Source: visit Tradinglounge.com and learn From the Experts Join TradingLounge Here
Previous: U.S. Dollar / Japanese Yen Elliott Wave Technical Analysis
VALUE Offer - Buy 1 Month & Get 3 Months!Click here
Access 7 Analysts Over 200 Markets Covered. Chat Room With Support