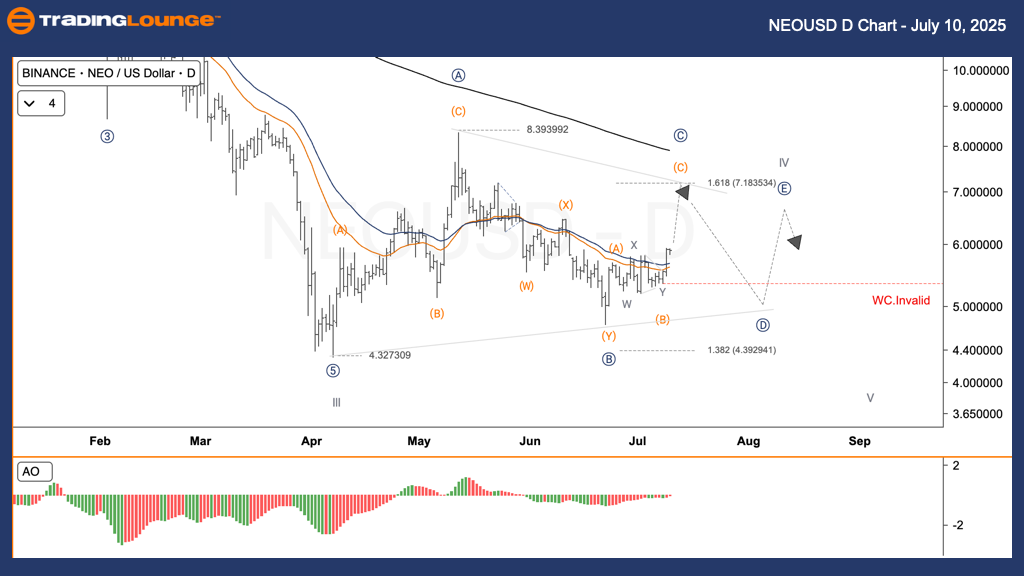
NEOUSD Elliott Wave Analysis TradingLounge Daily Chart,

NEO / U.S. Dollar (NEOUSD) Daily Chart Analysis

NEOUSD Elliott Wave Technical Analysis

Function: Counter Trend

Mode: Corrective

Structure: Triangle Pattern

Position: Wave C

Next Direction (Higher Degree): Awaiting Confirmation

Invalidation Level: Below $5.30

NEO / U.S. Dollar (NEOUSD) Trading Strategy

NEO has developed a well-defined A-B-C-D-E triangle structure within the larger corrective wave IV, starting in early 2025. Price is consolidating, showing narrowing movement as it oscillates between converging trendlines. Recently, the asset reached the triangle’s upper resistance, suggesting a possible completion of wave E and a potential start of downward wave V.

Trading Strategies

✅ Swing Trade (For Short-Term Traders):

With wave D likely concluding, a short-term decline in price could follow, consistent with expected triangle dynamics.

🟥 Invalidation Level:

A breakdown below $5.30 would nullify the current Elliott Wave structure and require reevaluation.

NEOUSD-Crypto-D-Char...


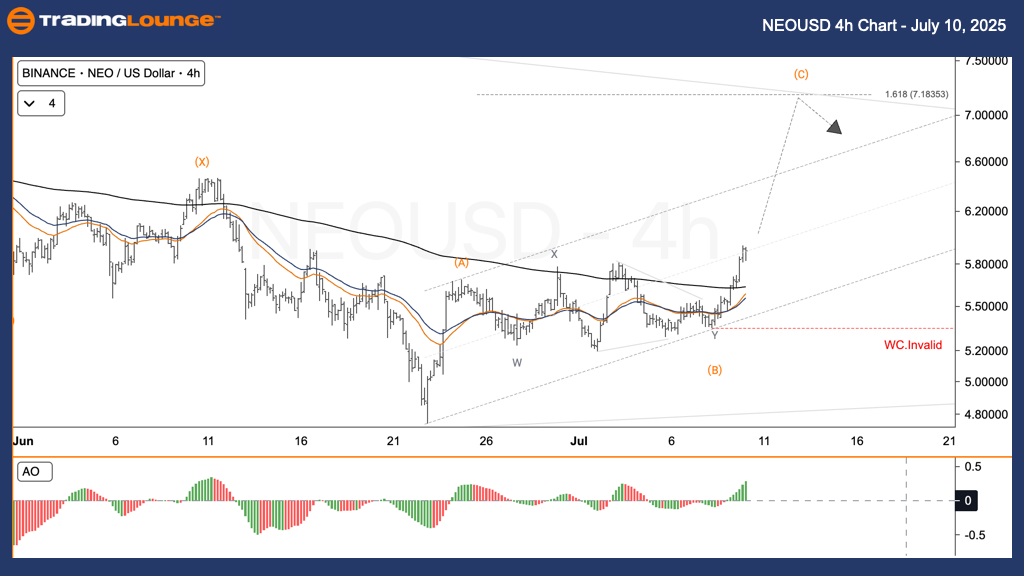
NEOUSD Elliott Wave Analysis TradingLounge H4 Chart,

NEO / U.S. Dollar (NEOUSD) 4-Hour Chart Analysis

NEOUSD Elliott Wave Technical Analysis

Function: Counter Trend

Mode: Corrective

Structure: Triangle Pattern

Position: Wave C

Next Direction (Higher Degree): Awaiting Confirmation

Invalidation Level: Below $5.30

NEO / U.S. Dollar (NEOUSD) Trading Strategy

The 4-hour timeframe highlights NEO’s steady rise within a bullish channel, forming wave C of the ongoing wave IV triangle. This climb is approaching the Fibonacci 1.618 extension level at $7.18, where a reversal into wave D may begin, in line with typical triangle progression.

Trading Strategies

✅ Swing Trade (For Short-Term Traders):

A shift from wave C to wave D may present a favourable short-selling opportunity, reflecting expected triangle movement.

🟥 Invalidation Level:

If the price falls below $5.30, the current wave count would become invalid.

Technical Analyst: Kittiampon Somboonsod, CEWA

Source: Visit Tradinglounge.com and learn from the Experts. Join TradingLounge Here

Previous: BTCUSD Elliott Wave Technical Analysis

VALUE Offer - $1 for 2 Weeks then $29 a month!Click here

Access 7 Analysts Over 200 Markets Covered. Chat Room With Support

NEOUSD-Crypto-4h-Cha...

Related

Polkadot Elliott Wave Analysis Predicts Bullish DOTUSD Reversal with Wave III Setup and $4.486 Key Resistance Level Ahead

Polkadot Elliott Wave Analysis Predicts Bullish DOTUSD Reversal with Wave III Setup and $4.486 Key Resistance Level Ahead

Polkadot (DOTUSD) shows a bullish reversal after a 5-wave decline, with Elliott Wave pointing to Wav...

Read More >
ASX: Mineral Resources Limited (MIN) - Elliott Wave Analysis & Stock Forecast With Possible Upward Trends

ASX: Mineral Resources Limited (MIN) - Elliott Wave Analysis & Stock Forecast With Possible Upward Trends

This article provides an Elliott Wave analysis for ASX: Mineral Resources Limited (MIN), highlightin...

Read More >
ChainLink / U.S. dollar(LINKUSD) Elliott Wave Technical Analysis 14 December 23

ChainLink / U.S. dollar(LINKUSD) Elliott Wave Technical Analysis 14 December 23

ChainLink / U.S. dollar(LINKUSD) Elliott Wave Technical Analysis 14 December 23 remains in an uptren...

Read More >
CIPLA Stock Analysis: Elliott Wave Forecast Reveals Corrective Wave Opportunities, Share Price Targets, and Key Trading Strategies

CIPLA Stock Analysis: Elliott Wave Forecast Reveals Corrective Wave Opportunities, Share Price Targets, and Key Trading Strategies

CIPLA’s stock trend using Elliott Wave Theory. Explore corrective wave structures, forecasted share...

Read More >
Visa Inc. (V) Stocks Elliott Wave Technical Analysis: Price Prediction, Key Levels, and Trading Opportunities

Visa Inc. (V) Stocks Elliott Wave Technical Analysis: Price Prediction, Key Levels, and Trading Opportunities

This analysis covers Visa Inc. (V) using Elliott Wave theory, offering insights into its current wav...

Read More >
Discover the best FTSE 100 stocks to buy: FTSE 100 (UK) Index Elliott Wave Technical Analysis and Trading

Discover the best FTSE 100 stocks to buy: FTSE 100 (UK) Index Elliott Wave Technical Analysis and Trading

Dive into our detailed FTSE 100 trading and UKX analysis to gain a comprehensive understanding of ma...

Read More >

$1 for 2 Weeks

then $29 a month!

What a Special Offer!

Trade Recommendations

Unleash the power of deversified trading with our comprehensive portfolio, covering 250+ markets:

  • Stock Trades
  • Crypto Trades
  • Forex Trades
  • Commodity Trades
Elliott Wave Analysis

Gain a competitive edge with expert insights and AI-powered Elliott Wave charting into:

  • Global Indices
  • US Stocks & ASX Stocks
  • Forex & Crypto
  • Commodities
Top-Notch Trading Tools

Equip yourself with the tools of success:

  • Real-time Chat rooms
  • Elliott Wave Algorithm
  • Portfolio tools
  • TradingLevels
  • Screener
  • Trading Game
7 Elliott Wave Analysts

Stay ahead of the market with daily charts and insightful videos
Your secret to strategic trading!

JOIN HERE


Welcome to TradingLounge (ASIC A.R.No. 321187), specialists in trades, trading education and technical analysis, covering stocks, indices, commodities, forex and cryptocurrencies.

When you join TradingLounge you have access to everything we offer, including trade tools, educational content and a social platform to chat with like-minded investors.

Read more

@Copyright 2024 by tradinglounge.com

Contact Us

Australian no: 02 4787 6020

International no: +61 (2) 47876020

Pay with:

Find us on