Welcome to our latest Elliott Wave analysis for JPMorgan Chase & Co. (JPM) as of June 7, 2024. This analysis provides an in-depth look at JPM's price movements using the Elliott Wave Theory, helping traders identify potential opportunities based on current trends and market structure. We will cover insights from both the daily and 4-hour charts to offer a comprehensive perspective on JPM's market behaviour.

JPM Elliott Wave Analysis Trading Lounge Daily Chart

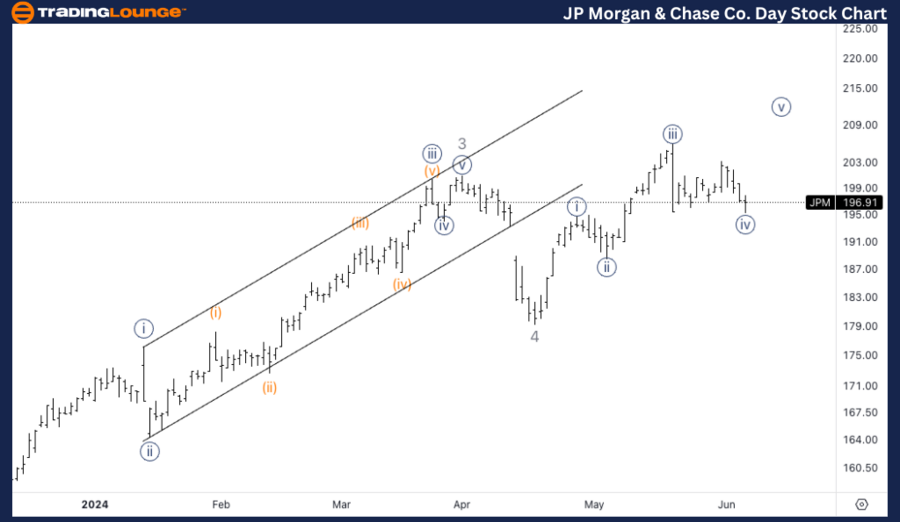
JP Morgan & Chase Co., (JPM) Daily Chart Analysis

Function: Trend

Mode: Impulsive

Structure: Motive

Position: Minor wave 5

Direction: Top in wave 5.

Details: Looking for upside into wave 5 to complete a large uptrend. If not we could start to fall back down to complete a flat wave 4.

JPM Elliott Wave Technical Analysis

In our Elliott Wave analysis of JPMorgan Chase & Co. (JPM), we observe an impulsive trend characterized by a motive structure. JPM is currently positioned in Minor Wave 5, which suggests the potential completion of a large uptrend. As JPM seeks to complete wave 5, there is an upside bias, but traders should also be cautious of the possibility of falling back down to form a flat wave 4 if the current uptrend does not sustain. Monitoring key resistance levels will be crucial for validating the upward trajectory and ensuring the completion of wave 5.
JP-Morgan-Chase-Co-D...


JPM Elliott Wave Analysis Trading Lounge 4Hr Chart

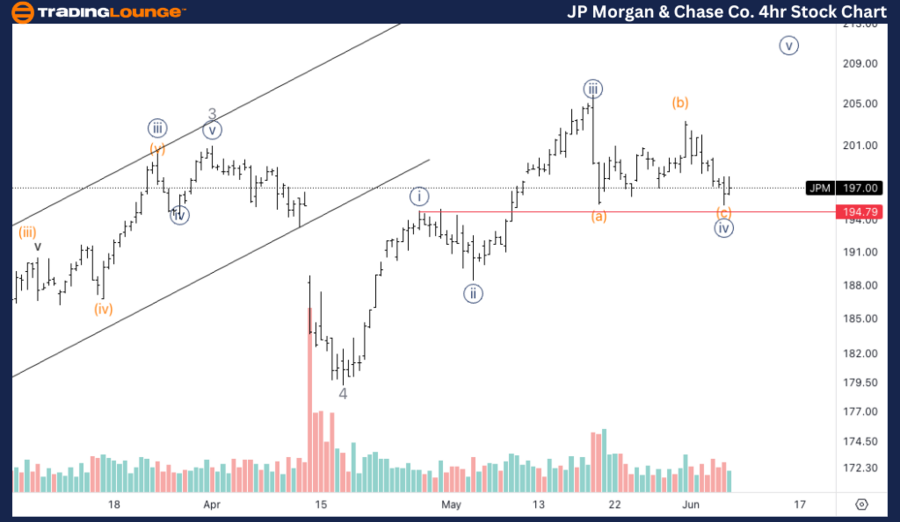
JP Morgan & Chase Co., (JPM) 4Hr Chart Analysis

JPM Elliott Wave Technical Analysis

Function: Counter Trend

Mode: Corrective

Structure: Flat

Position: Wave (c) of {iv}.

Direction: Bottom in wave (c).

Details: Looking for a bottom soon, or else we will cross the invalidation level at $194.8, volume seems to be suggesting a potential bottom.

META Technical Analysis

On the 4-hour chart, JPM is following a counter-trend corrective mode within a flat structure, specifically in wave (c) of {iv}. The current analysis indicates that JPM is approaching a potential bottom in wave (c). The critical invalidation level is at $194.80, and volume analysis suggests a potential bottom formation. Traders should watch for confirmation signals of a bottom around this level, which could provide a strategic entry point for long positions anticipating the start of the next impulsive wave.

Technical Analyst: Alessio Barretta

Source: visit Tradinglounge.com and learn From the Experts Join TradingLounge Here 

See Previous: Spotify Technology S.A. (SPOT) Elliott Wave Technical Analysis

Special Trial Offer - 0.76 Cents a Day for 3 Months! Click here

Access 7 Analysts Over 170 Markets Covered. Chat Room With Support
JP-Morgan-Chase-Co-4...

Related

S&P 500 ELLIOTT WAVE ANALYSIS, 23 FEB 2022

S&P 500 ELLIOTT WAVE ANALYSIS, 23 FEB 2022

SP500 The Feds rise in rates to control inflation are placing more pressure on the markets. Plus the...

Read More >
Larsen & Toubro Elliott Wave Analysis Reveals Bullish Impulse Wave Formation on Daily and Weekly Charts with Key Trading Levels

Larsen & Toubro Elliott Wave Analysis Reveals Bullish Impulse Wave Formation on Daily and Weekly Charts with Key Trading Levels

Larsen & Toubro is forming a bullish Elliott Wave pattern, with impulse waves in development on dail...

Read More >
AAVEUSD Elliott Wave Technical Analysis: Detailed Price Prediction, A-B-C Pattern, and Expert Trading Strategies

AAVEUSD Elliott Wave Technical Analysis: Detailed Price Prediction, A-B-C Pattern, and Expert Trading Strategies

Elliott Wave analysis for AAVE/USD, focusing on Wave IV correction patterns, price predictions, and ...

Read More >
U.S. Dollar / Swiss Franc (USDCHF) Elliott Wave Forecast: Daily and 4H Charts with Key Support and Resistance Analysis

U.S. Dollar / Swiss Franc (USDCHF) Elliott Wave Forecast: Daily and 4H Charts with Key Support and Resistance Analysis

USDCHF shows a bearish Elliott Wave structure with wave 3 unfolding, signaling further downside. Dai...

Read More >
S&P/TSX 60 Elliott Wave Technical  Analysis: Market Trends, Corrective Wave Structure, Stock Forecast, Trading Strategy

S&P/TSX 60 Elliott Wave Technical Analysis: Market Trends, Corrective Wave Structure, Stock Forecast, Trading Strategy

Elliott Wave Analysis of the S&P/TSX 60 index, covering key aspects such as counter-trend movements,...

Read More >
IBEX 35 (Spain) index Wave Technical Analysis: Bullish Trend, Impulsive Wave Count, Market Trends, and Trading Opportunities Explained

IBEX 35 (Spain) index Wave Technical Analysis: Bullish Trend, Impulsive Wave Count, Market Trends, and Trading Opportunities Explained

IBEX 35 Elliott Wave Analysis provides a detailed technical breakdown of the market trend, highlight...

Read More >

$1 for 2 Weeks

then $29 a month!

What a Special Offer!

Trade Recommendations

Unleash the power of deversified trading with our comprehensive portfolio, covering 250+ markets:

  • Stock Trades
  • Crypto Trades
  • Forex Trades
  • Commodity Trades
Elliott Wave Analysis

Gain a competitive edge with expert insights and AI-powered Elliott Wave charting into:

  • Global Indices
  • US Stocks & ASX Stocks
  • Forex & Crypto
  • Commodities
Top-Notch Trading Tools

Equip yourself with the tools of success:

  • Real-time Chat rooms
  • Elliott Wave Algorithm
  • Portfolio tools
  • TradingLevels
  • Screener
  • Trading Game
7 Elliott Wave Analysts

Stay ahead of the market with daily charts and insightful videos
Your secret to strategic trading!

JOIN HERE


Welcome to TradingLounge (ASIC A.R.No. 321187), specialists in trades, trading education and technical analysis, covering stocks, indices, commodities, forex and cryptocurrencies.

When you join TradingLounge you have access to everything we offer, including trade tools, educational content and a social platform to chat with like-minded investors.

Read more

@Copyright 2024 by tradinglounge.com

Contact Us

Australian no: 02 4787 6020

International no: +61 (2) 47876020

Pay with:

Find us on