Welcome to our latest Elliott Wave analysis for NVIDIA Corp. (NVDA). This analysis offers a detailed examination of NVIDIA's price movements using the Elliott Wave Theory, assisting traders in identifying potential opportunities based on current trends and market structures. We will explore insights from both the daily and 4-hour charts to provide a thorough perspective on NVIDIA's market behavior.

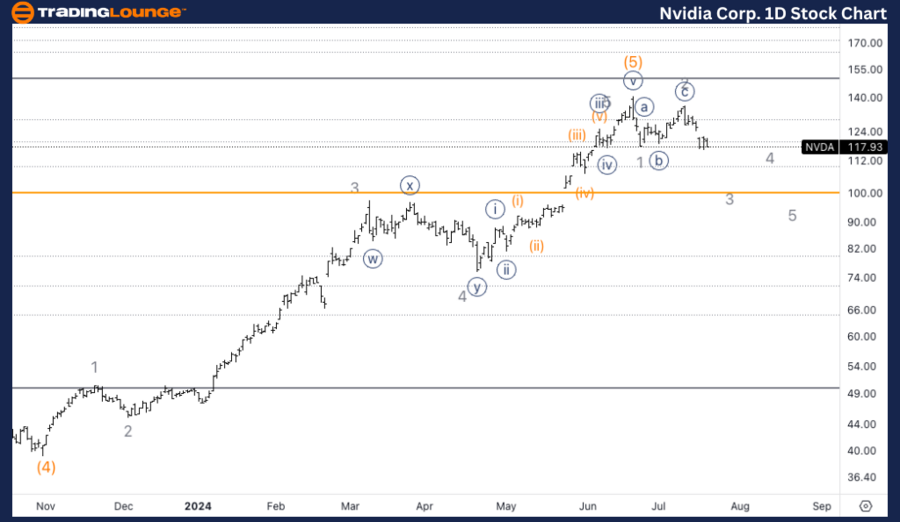
NVDA Elliott Wave Analysis Trading Lounge Daily Chart

NVIDIA Corp., (NVDA) Daily Chart Analysis

NVDA Elliott Wave Technical Analysis

FUNCTION: Counter Trend

MODE: Corrective

STRUCTURE: ZigZag

POSITION: Intermediate wave (A)

DIRECTION: Downside in wave 3

DETAILS: The analysis suggests a significant top in wave (5) or the potential for continued upward movement after a clear three-wave move to the downside, indicating one more leg lower before resuming upward.

NVDA Stock Technical Analysis – Daily Chart

The daily chart analysis shows that NVDA may have reached a significant top in wave (5) or is set to continue higher after a corrective phase. Recent price movements reveal a clear three-wave pattern to the downside, suggesting one more leg lower before any potential upward resumption. Traders should watch for signs indicating the completion of wave 3 within this corrective phase.

NVIDIA-Corp-1D-Stock...

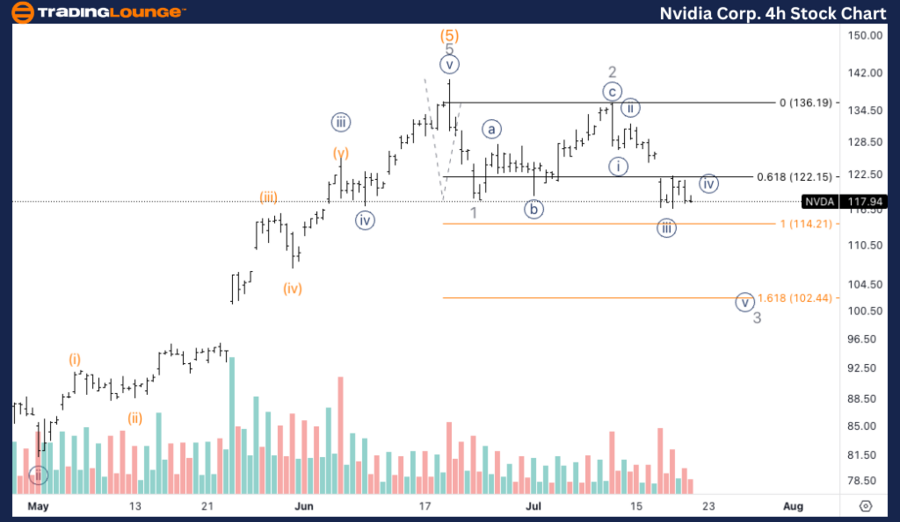
NVDA Elliott Wave Analysis Trading Lounge 4H Chart

NVIDIA Corp., (NVDA) 4H Chart Analysis

NVIDIA Corp Elliott Wave Technical Analysis

FUNCTION: Counter Trend

MODE: Corrective

STRUCTURE: ZigZag

POSITION: Wave 3 of (A)

DIRECTION: Downside in wave 3

DETAILS: The 4-hour chart reveals a five-wave move into wave 3, indicating a strong downward impulse. Common targets for wave 3 are around $102, supported by the 1.618 extension of wave 3 versus wave 1, which is confirmed by volume.

NVIDIA CorpTechnical Analysis – 4H Chart

The 4-hour chart highlights a five-wave move into wave 3, showing a strong downward impulse. Targets for wave 3 are commonly around $102, supported by the 1.618 extension of wave 3 versus wave 1. Volume analysis supports this target.

Technical Analyst: Alessio Barretta

Source: visit Tradinglounge.com and learn From the Experts Join TradingLounge Here 

See Previous: Visa Inc. (V) Ellott Wave Technical Analysis

Special Trial Offer - 0.76 Cents a Day for 3 Months! Click here

Access 7 Analysts Over 170 Markets Covered. Chat Room With Support

NVIDIA-Corp-4H-Stock...

Related

IBEX 35 (Spain) Index Elliott Wave Technical Analysis: Stay Ahead with the Latest Market Trends and Forecasts

IBEX 35 (Spain) Index Elliott Wave Technical Analysis: Stay Ahead with the Latest Market Trends and Forecasts

This article provides a comprehensive IBEX 35 Elliott Wave Analysis, focusing on Spain's stock m...

Read More >
The Procter & Gamble Co.(PG:NYSE) Elliott Wave Technical Analysis 1 December 23

The Procter & Gamble Co.(PG:NYSE) Elliott Wave Technical Analysis 1 December 23

The Procter & Gamble Co.(PG: NYSE) Elliott Wave Technical Analysis dated 1 December 23, PG Stock Mar...

Read More >
Riding the Uptrend: ChainLink/U.S. Dollar (LINKUSD) Elliott Waves Technical Analysis by Expert

Riding the Uptrend: ChainLink/U.S. Dollar (LINKUSD) Elliott Waves Technical Analysis by Expert

Discover the keys to unlocking profitable trades in the ChainLink/USD (LINKUSD) market with expert i...

Read More >
 Understand the future price movements of Wheat Commodity Elliott Wave Technical Analysis

Understand the future price movements of Wheat Commodity Elliott Wave Technical Analysis

Get the latest Elliott Wave analysis and wheat price forecasts, including detailed technical insight...

Read More >
AXIS BANK LTD. Elliott Wave Analysis: Share Price Forecast, Technical Trends, and Key Support & Resistance Levels

AXIS BANK LTD. Elliott Wave Analysis: Share Price Forecast, Technical Trends, and Key Support & Resistance Levels

AXIS BANK stock analysis using Elliott Wave theory. This article covers share price forecasts, techn...

Read More >
Eli Lilly & Co.(LLY:NYSE) Elliott Wave Technical Analysis 28 November 23

Eli Lilly & Co.(LLY:NYSE) Elliott Wave Technical Analysis 28 November 23

Eli Lilly & Co.(LLY:NYSE) Elliott Wave Technical Analysis dated 28 November 23 with 1-hour and 4-hou...

Read More >

Buy 1 Month

Get 3 Months!

Special Offer:

Trade Recommendations

Unleash the power of deversified trading with our comprehensive portfolio, covering:

  • Stock Trades
  • Crypto Trades
  • Forex Trades
  • Commodity Trades
Elliott Wave Analysis

Gain a competive edge with expert insights in to:

  • Global Indices
  • US Stocks & ASX Stocks
  • Forex & Crypto
  • Commodities
Top-Notch Trading Tools

Equip yourself with the tools of success:

  • Social Chat
  • Elliott Wave Algorithm
  • Screener
  • TradingLevels
  • Trading Game
7 Elliott Wave Analysts

Stay ahead of the market with daily charts and insightful videos
-Your secret to strategic trading!

JOIN HERE


Welcome to TradingLounge (ASIC A.R.No. 321187), specialists in trades, trading education and technical analysis, covering stocks, indices, commodities, forex and cryptocurrencies.

When you join TradingLounge you have access to everything we offer, including trade tools, educational content and a social platform to chat with like-minded investors.

Read more

@Copyright 2024 by tradinglounge.com

Contact Us

Australian no: 02 4787 6020

International no: +61 (2) 47876020

Pay with:

Find us on